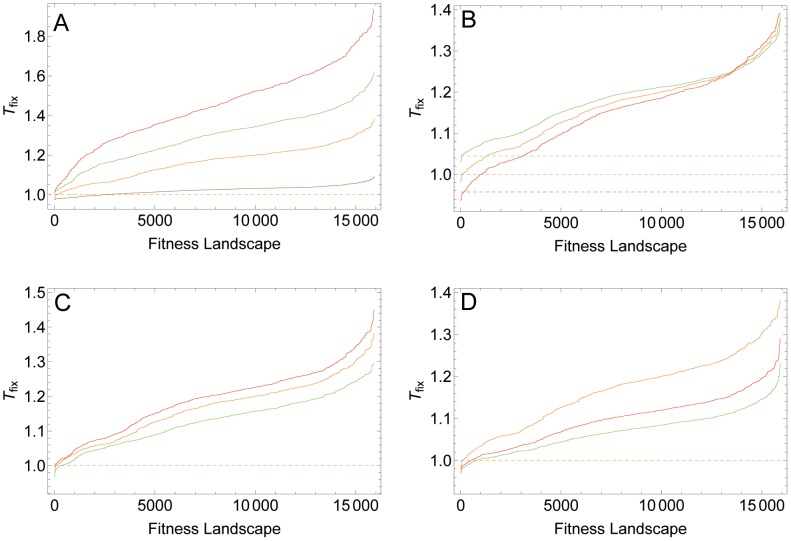
Figure 4. Effect of different parameters on T fix on all possible four-locus fitness topographies with up to 10 LFGs.
In all plots, the standard parameter set was used and one parameter was varied. Solid lines shows independently ranked T
fix values for all fitness topographies. For comparison, the dashed lines show T
fix in the corresponding fitness landscape with no LFG. A) Effect of recombination rate. Red, green, orange and brown curves correspond to r values of 0.1, 0.075, 0.05 and 0.01, respectively. B) Effect of baseline epistasis. Green, orange and red curves correspond to  values of 0.95, 1.0 and 1.05, respectively. C) Effect of mutation rate. Red, orange and green curves correspond to
  values of 10−6, 10−5 and 10−4, respectively. D) Effect of selection coefficient. Orange, red and green curves correspond to
  values of 0.050, 0.075 and 0.1, respectively. Note the different scales of the y-axes in plots A to D.

