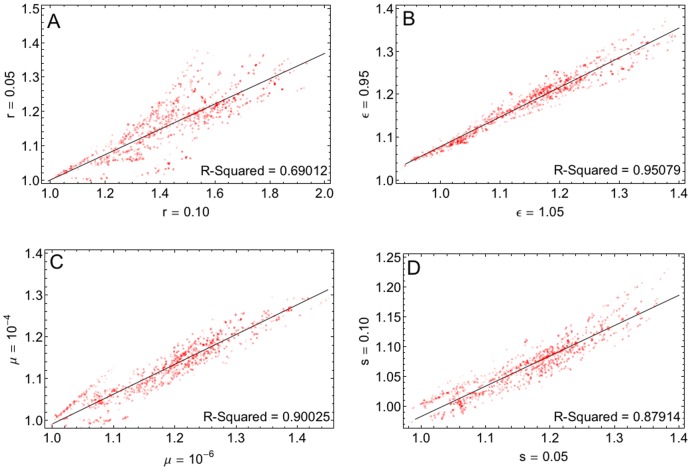
Figure 5. Robustness of the relative rate of adaptation Tfix with regard to the parameters of the model: A) recombination rate, B) baseline epistasis, C) mutation rate and D) selection coefficient.
Each point in the above plots represents one fitness topography and its position is given by Tfix with two different parameter values. Other parameters take the same values as in Figure 4.

