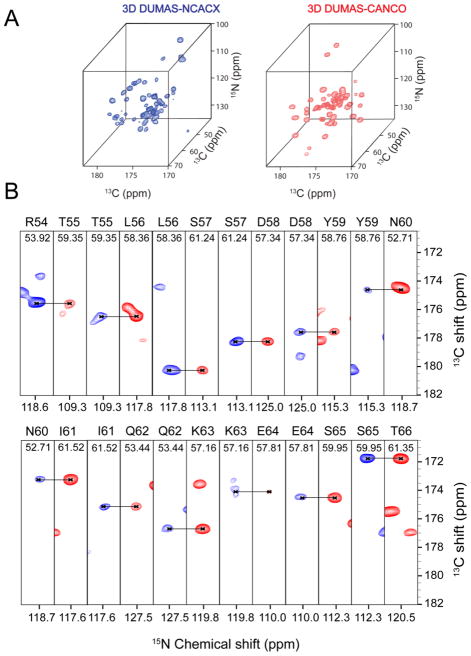
Figure 3.
(A) Three dimensional spectra of NCACX (blue) and CANCO (red) acquired using 3D DUMAS-NCACX-CANCO, with 96 scans and 21 increments in both indirect dimensions. Total experimental time was 4.16 days. (B) 15N-13CO strip plots of the above 3D spectra NCACX (blue) and CANCO (red) at corresponding Cα chemical shifts. The sequential backbone resonance assignments for residues spanning the region 54–66 are shown. DARR mixing time of 20 ms was used.

