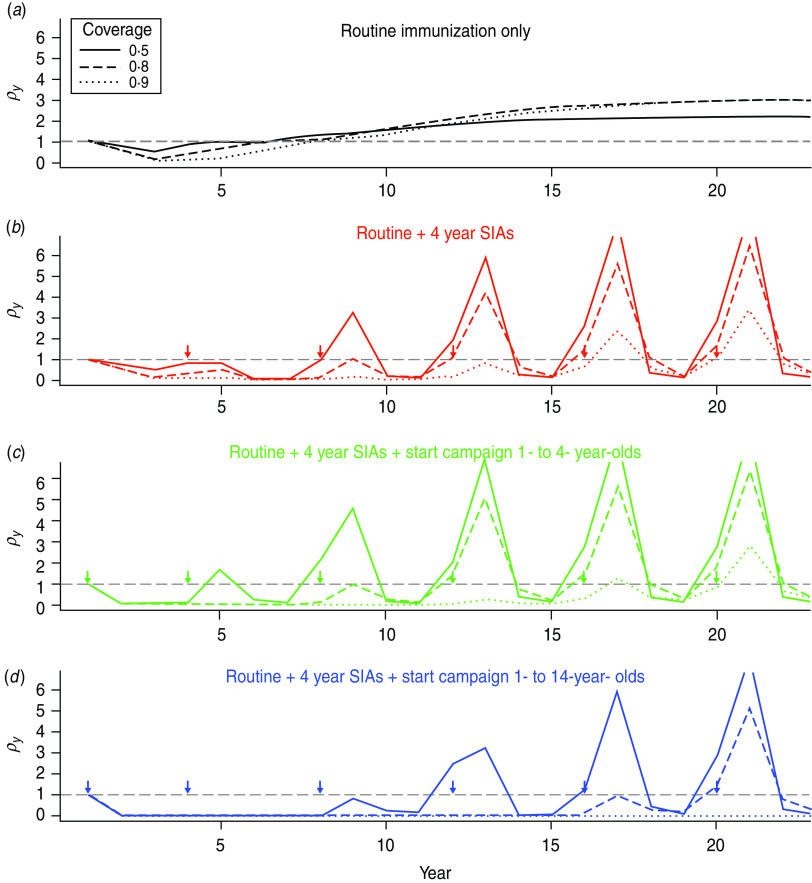
Fig. 1.
Dynamics of the relative congenital rubella syndrome (CRS) burden for R0 = 12, and 40 births/1000 per year for three different levels of routine vaccination coverage (see key) for four different immunization strategies (arrows indicate timing of SIAs, or starting campaigns). The x-axis shows time in years, and the y-axis indicates ρy, the ratio of yearly summed CRS cases in the presence and absence of vaccination. (b–d) Lines corresponding to coverage higher than 50% lie close to the bottom of the plot where ρy = 0.

