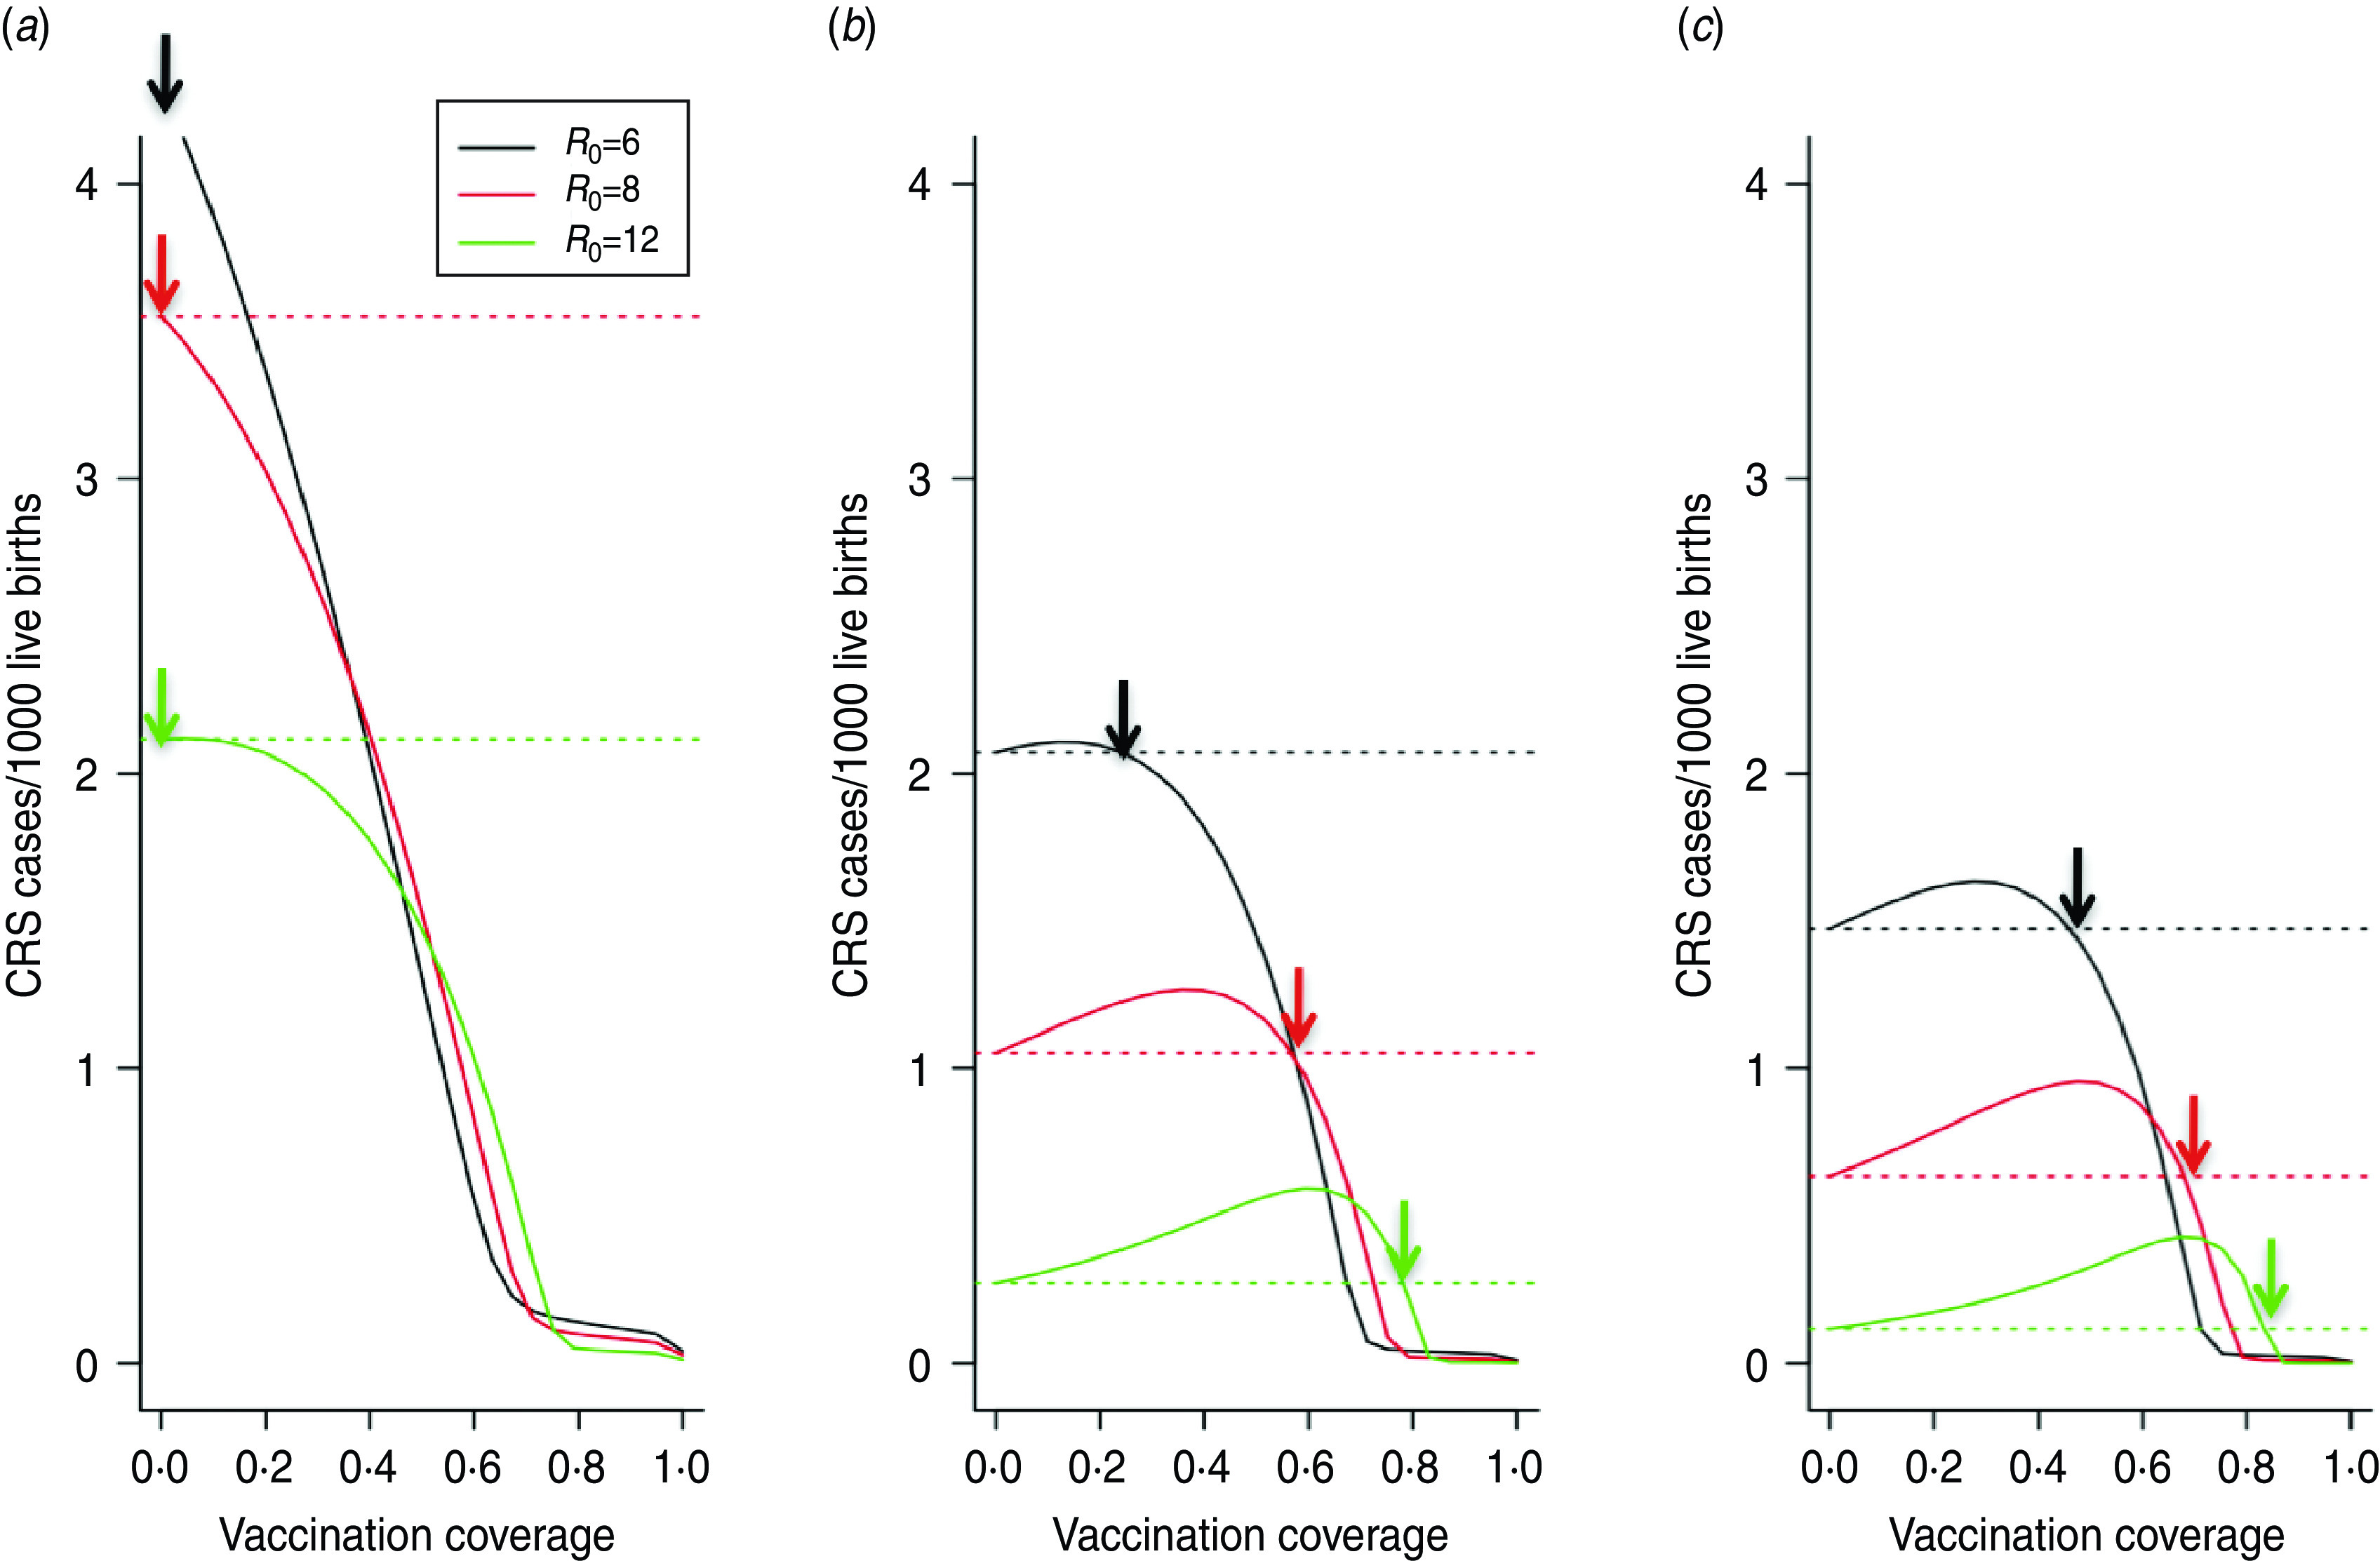
Fig. 2.

Effect of routine vaccination coverage levels on congenital rubella syndrome (CRS) burden over 30 years, for different levels of routine infant and young children vaccination coverage only, total number of CRS cases/1000 live births for a population of 750 000 across different birth rates for (a) 12 births/1000, (b) 30 births/1000 and (c) 40 births/1000). Three levels of R0 are shown (in colour) under weak seasonality in transmission (α = 0·2; higher seasonality does not alter results). Horizontal lines indicate the number of CRS cases/1000 live births occurring in the absence of vaccination; points on each curve above the corresponding line correspond to negative outcomes of vaccination; arrows indicate the level of coverage required to avoid this. Note that the exact numbers on the y-axis in any particular context will depend on the precise pattern of the fertility curve, which may itself vary with birth rate. Here, it is assumed that the pattern over age follows that for Niger.
