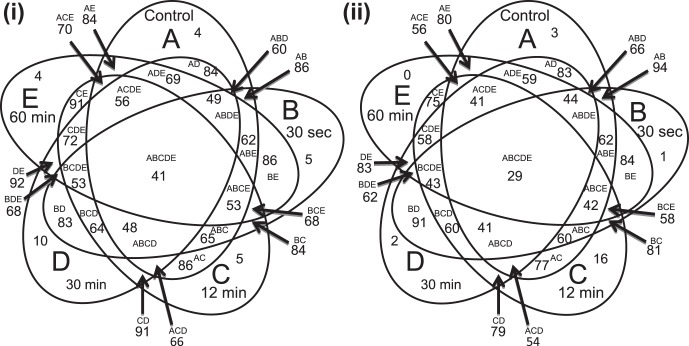
Figure 4. .
Venn diagram comparing control and experimental cornea. Ellipse A represents phosphatidylcholines (PCs) of the control cornea. Ellipses B to E represent the PCs of the 30-second, 12-minute, 30-minute, and 60-minute NaOH-exposed cornea, respectively. The outer, non-overlapping parts of the ellipses represent the number of PC species unique to each group. Overlapping sections of the diagram represent the number of PC species common to more than one group as indicated by the letters. The sizes of the sections are not proportional to the number of species represented. (i) Porcine cornea; (ii) Human cornea.

