Figure 5. .
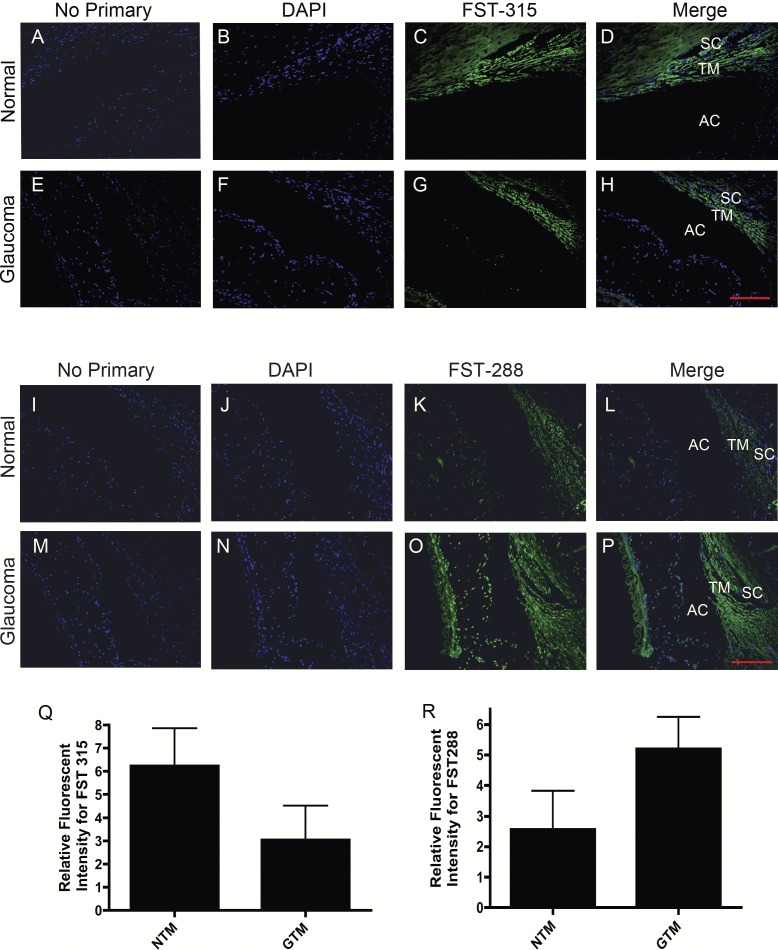
Representative images (200×) of immunohistochemical staining for FST 315 and FST 288 proteins in four age-matched NTM and GTM tissues. No primary control (A, E, I, M). DAPI stained nuclei (B, F, J, N). FST 315 expression in NTM (C) and GTM (G) tissues. FST 288 expression in NTM (K) and GTM (O) tissues. FST 315 and FST 288 staining merged with DAPI in NTM (D, L) and GTM (L, P) TM tissues. Relative intensity measurements of FST 315 in four age-matched NTM and GTM tissues (Q). Relative intensity measurements of FST 288 in four age-matched NTM and GTM tissues (R). The relative differences in staining intensities between NTM and GTM were not statistically significant. Scale bar = 100 μm.

