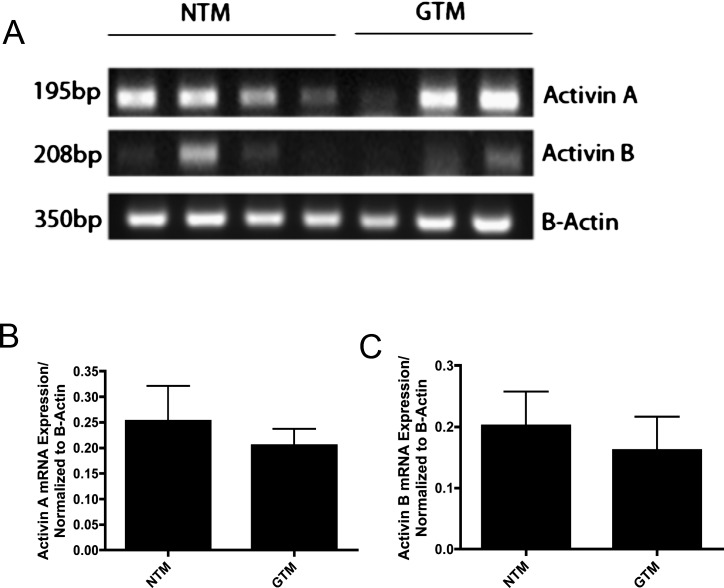
Figure 9. .
Act A and Act B mRNA expression in cultured NTM and GTM cells. (A) Ethidium bromide–stained gel of RT-PCR amplified products for Act A and B, and actin from cultured NTM (n = 4) and GTM (n = 3) cells. (B) Act A mRNA expression in NTM versus GTM was not significantly different. (C) Act B mRNA expression in NTM versus GTM was not significantly different.

