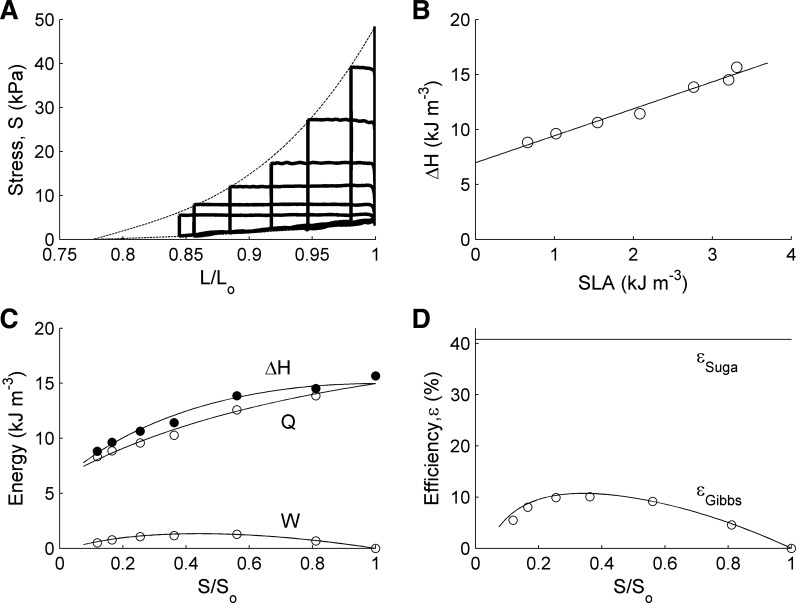
Fig. 5.
Experimental data and model-derived curves. A: stress-length (where stress = force per cross-sectional area) work loops (thick lines) at various afterloads experienced by a single rat right-ventricular trabecula. Cubic functions (thin lines) were fitted through the end-systolic and end-diastolic points of the individual work loops. B: enthalpy (heat + work) as a function of stress-length area (SLA); symbols: experimental data; straight line results from linear regression. C: the symbols denote the experimentally observed values of enthalpy, work, and heat as functions of relative peak stress (S/So). D: symbols denote εGibbs = W/ΔH as a function of relative peak stress (derived from C). Continuous lines in C and D were derived using the regression parameters arising from the fitted lines in A and B and have been superimposed on the observed experimental data. Trabecula of length 2.63 mm and diameter 275 μm.

