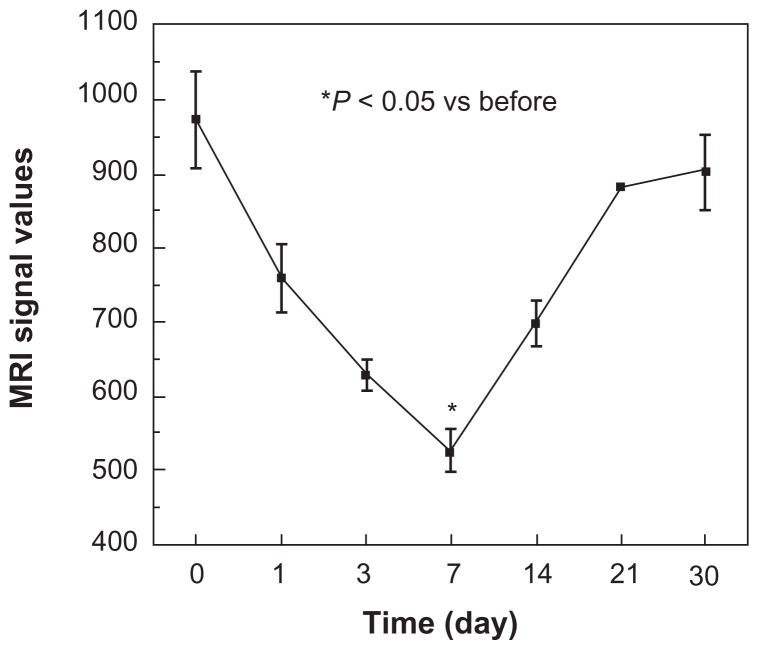
Figure 7.
Magnetic resonance imaging (MRI) signal intensity curves obtained from the local vascular wall of the injured common carotid artery.
Notes: At days 1 and 3, the MRI signal values showed a modest reduction, and statistically significant changes in signal levels were observed at 7 days (P < 0.05), as indicated by the curve. Afterwards, the signal levels gradually increased to normal levels on day 30.

