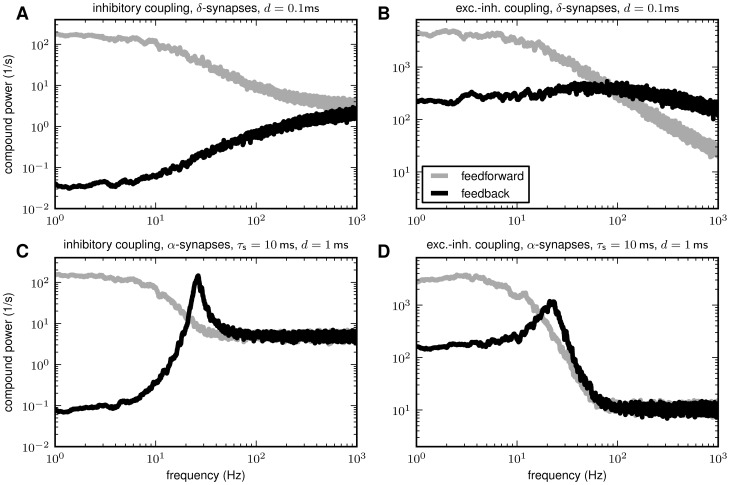
Figure 2. Suppression of low-frequency fluctuations in recurrent LIF networks
with purely inhibitory (A, C) and mixed excitatory-inhibitory coupling
(B, D) for instantaneous synapses with delay  (A, B) and
low-pass synapses with
  (C, D).
Power-spectra  of
population rates
  for the
feedback (black) and the feedforward case (gray; cf. Fig. 1). See Table 1 and Table 2 for details
on network models and parameters. In C and D, local synaptic inputs are
modeled as currents
  with
with  -function shaped kernel
  with time
constant
  (
( denotes
Heaviside function). (Excitatory) Synaptic weights are set to
 (see Table 1 for
details). Simulation time
  . Single-trial spectra smoothed by moving average
(frame size
  ).
).

