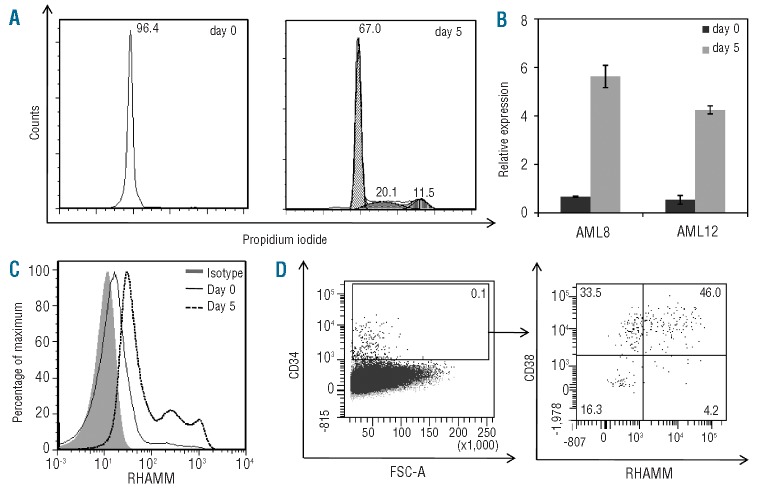
Figure 2.
RHAMM expression before and after in vitro culture of AML cells. (A) Cell cycle analysis of a representative bulk AML sample (AML8) before (day 0) and after in vitro culture (day 5). Freshly isolated AML samples are mainly in the G0/G1 phase. Dean/Jett/Fox analysis after 5 days of in vitro culture shows 67% of cells in the G0/G1 phase, 20.1% in the S phase and 11.5% in the G2/M phase. (B) RT-qPCR analysis on mRNA is shown for the expression of RHAMM in freshly isolated bulk AML samples (day 0) and in AML samples after 5 days of in vitro culture (day 5). Results were normalized to the geometric mean of the expression of GAPDH, R18S and YWHAZ, and are shown relative to the RHAMM transcript level in K562 cells. Data shown are the mean values and standard deviations (SD) calculated from duplicate PCR of the same sample. Results are shown for two representative AML samples (AML8 and AML12). (C) Histogram demonstrating flow cytometric results of intracellular RHAMM expression on day 0 and day 5 after in vitro culture of a representative bulk AML sample (AML8). Compared with isotype staining (day 0 = day 5) (solid gray) and expression on day 0 (full line), clear up-regulation can be seen after 5 days of culture (dotted line). (D) Dot plots are gated on the viable cells and show the further gating strategy. Gated on the CD34+ AML cells (AML8; left dot plot), the right dot plot shows intracellular RHAMM expression after 5 days of in vitro culture. The expression in the CD34+CD38- subpopulation remains low, compared with that in the CD34+CD38+ population. Gated on isotype control (not shown).

