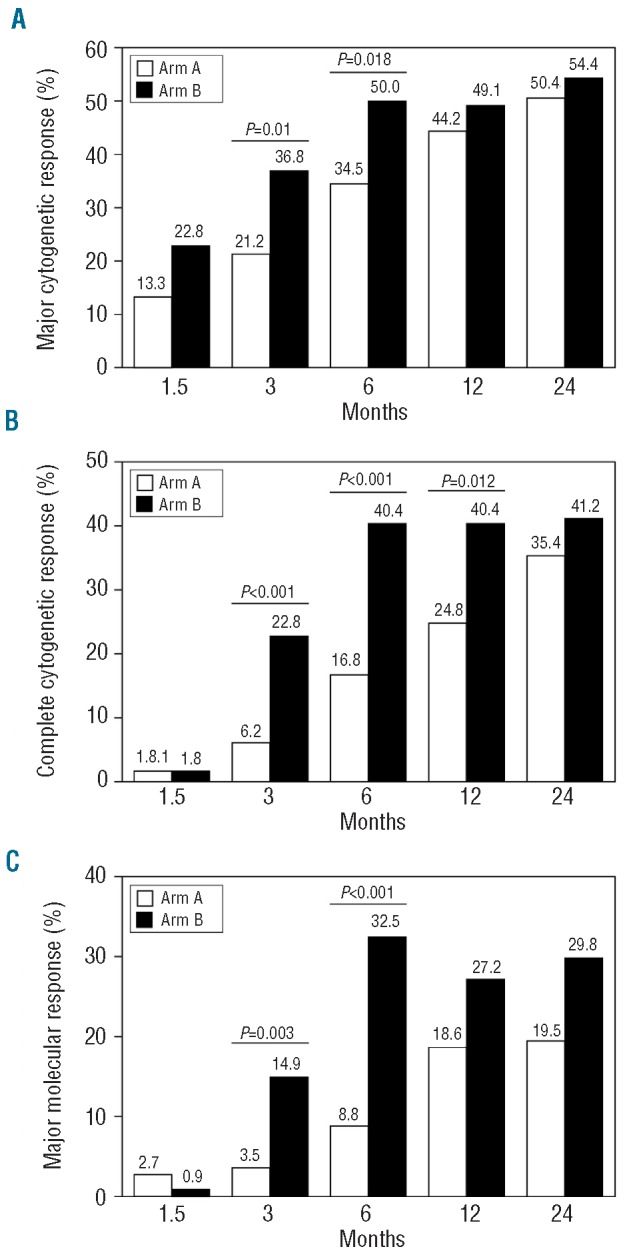
Figure 1.

Cytogenetic and molecular responses at different time points by intention-to-treat analysis. Major cytogenetic responses (A), complete cytogenetic responses (B) and major molecular responsesIS (C) are shown as response rates at 1.5, 3, 6, 12 and 24 months for the SD arm (arm A; white bars) and the experimental HD arm (arm B; black bars).
