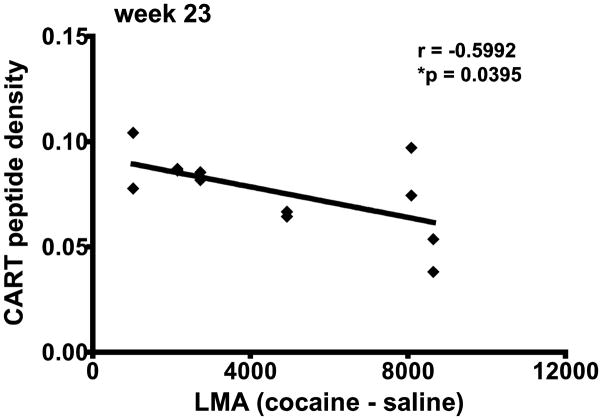
Figure 8.
Correlation analysis between CART density and cocaine-induced LMA in rats at 23 weeks after intra-NAc injections. The data represents individual values for all rats in both the shRNA and scrambled RNA groups. Each animal had a total of 2 microinjections (bilateral), one into each hemisphere and therefore 2 measurements corresponding to each brain were taken/rat for the CART density in the NAc (see Figure 7 legend). The difference between cocaine and saline total LMA (cocaine LMA 30 min – saline LMA 30 min) for each rat was plotted on the x-axis and the CART peptide density for the rat was plotted on the y-axis. The difference between cocaine and saline LMA represents the actual cocaine effect. The analysis shows that there is a correlation between CART density and cocaine-saline LMA (r = −0.5992, R2 = 0.3591, *p = 0.0395).

