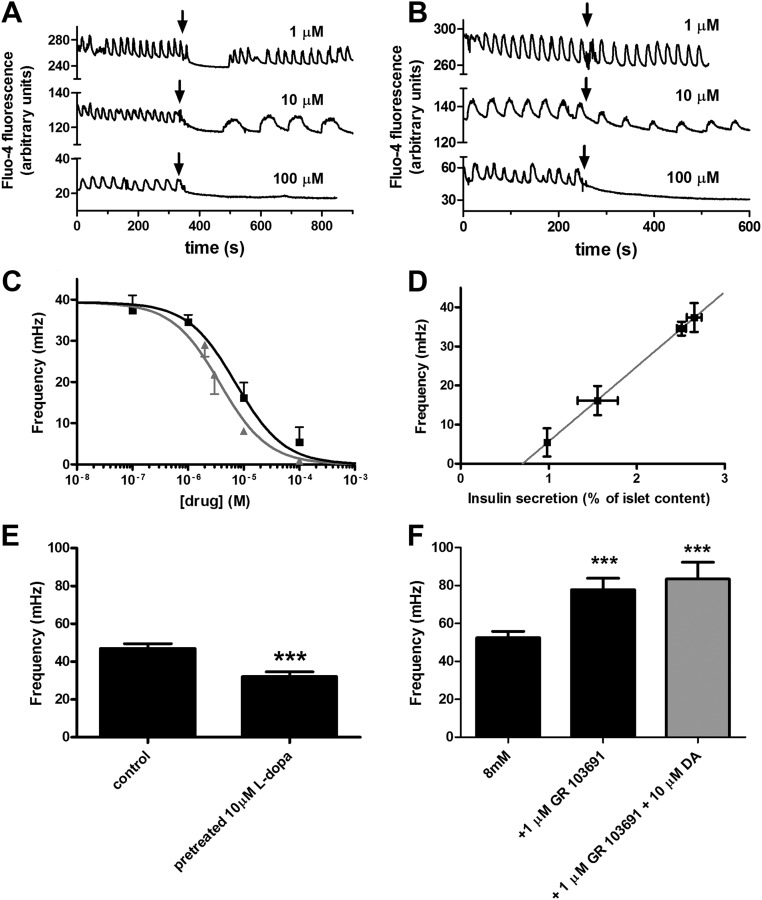
Fig. 4.
The effects of dopamine and l-dopa on [Ca2+]i oscillation frequency in isolated islets. A, Representative patterns of [Ca2+]i oscillations from a single islet before and after dopamine stimulus. The typical oscillation pattern, stimulated by increasing glucose concentration from 2 mm to 8 mm, is shown in in the first 300 sec; the pattern changed after the addition of dopamine at the indicated concentration. Black arrows indicate the time when dopamine was added; the three plots are offset for an easier comparison. B, Representative patterns of [Ca2+]i oscillations from a single islet before and after l-dopa stimulus. The oscillations were triggered by increasing glucose concentration from 2 mm to 8 mm; black arrows indicate the time when l-dopa was added. C, Sigmoidal dose-response curve fit of [Ca2+]i oscillation frequency in response to treatment with dopamine (▴) or l-dopa (■) in conjunction with 8 mm glucose stimulus; gray line indicates, best-fit EC50 = 3.8 μm, R2 = 0.78 (n = 4–7); black line indicates, best-fit EC50 = 7.2 μm, R2 = 0.89 (n = 5–14); The difference between EC50 values is statistically significant with a P < 0.05. D, Plot of [Ca2+]i oscillation frequency vs. insulin secretion from two independents sets of experiments; the gray line represents the linear fit of the data (R2 = 0.999); Pearson's correlation coefficient r = 1 with P < 0.0001. E, The [Ca2+]i oscillation frequency of control islets vs. islets with elevated dopamine content resulting from a pretreatment with l-dopa as indicated (n = 8); ***, P < 0.001. F, The [Ca2+]i oscillation frequency of control islets vs. islets treated with D3 antagonist (GR 103691) or a mixture of D3 antagonist and dopamine as indicated (n = 9–14); ***, P < 0.001. DA, Dopamine; s, second.

