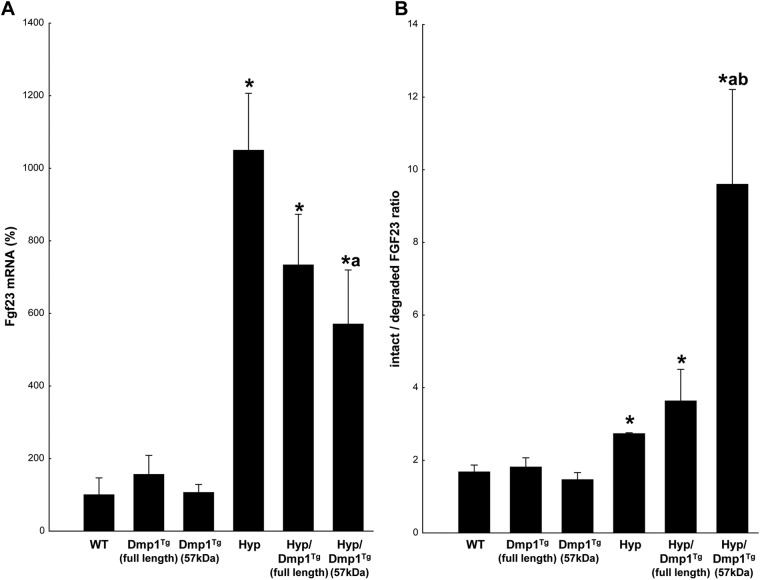
Fig. 5.
A, mRNA expression of Fgf23 measured by RT-PCR in hindlimb bones. Values are expressed as a percentage of the WT value set at 100%. B, Ratio between the nondegraded and degraded forms of FGF23 in the serum: higher values correspond to a decrease in the degradation of FGF23. Values are expressed as mean ± se; n = 5 mice/group; P < 0.05 vs. WT (*), Hyp (a), and Hyp/Dmp1Tg(full-length) (b).

