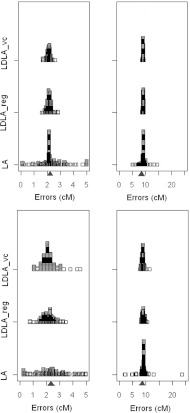
Fig. 1.
Errors (cM) distribution of the linkage method and two LDLA methods with a 15 half-sib family design for a 5 cM (left side) and 25 cM (right side) chromosomal region and for the two marker densities (0·25 cM (upper) and 0·05 cM (lower)). LA, linkage analysis; LDLA_reg and LDLA_vc, LDLA analysis by regression model and IBD-based variance component, respectively. The blue triangle is the true QTL location.

