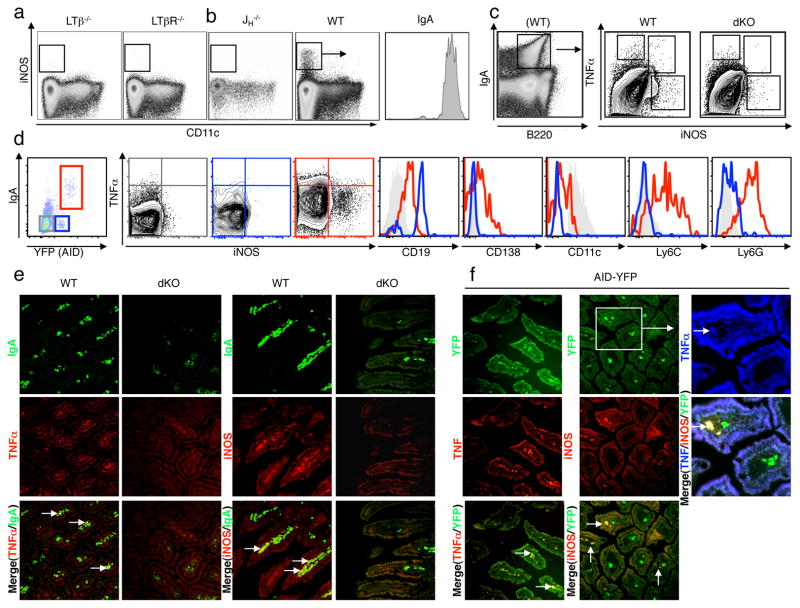
Figure 1. IgA+ plasma cells in the small intestinal lamina propria can produce iNOS and TNFα.
a,b, Small intestinal lamina propria cells (LPC) from LTβ−/− and LTβR−/−, JH−/− and WT mice were isolated and viable cells were analyzed for CD11c and iNOS expression by flow cytometry. Please see quantification in Supplemental Table I. iNOS+ cells were gated and analysed for IgA expression. c, Small intestinal LPC cells were isolated from WT and TNFα−/−iNOS−/− double-deficient (dKO) mice and analysed for IgA, TNFα and iNOS expression (note a WT example here for IgA/B220 staining is shown. Although IgA-expressing cells are reduced in dKO mice as per Fig. 3c, it is possible to still gate on IgA-expressing cells within the LP of dKO mice). Frequencies of TNFα+ and iNOS+ populations can be found in Suppl. Table II. d, Intestinal LPC from AID-YFP animals were isolated and viable cells were analyzed for their expression of IgA and YFP. Specifically, YFP−IgA− = grey rectangle, YFP+IgA− = blue rectangle and YFP+IgA+ = red rectangle, please see Suppl. Table III for relative frequency of each population. These gated populations were further analyzed for their expression of iNOS and TNFα (note that cross-hairs were added based on isotype control staining; see Suppl. Table IV for average frequencies of each population). Expression of other lineage-specific markers for each of the three populations are denoted as histograms (YFP−IgA− = grey trace, YFP+IgA− = blue trace, YFP+IgA+ = red trace). Note that for CD11c expression, YFP−IgA− dendritic cells were used as a positive control (grey trace). Representative plots are shown from n=9 mice. Sections of small intestines from WT versus dKO mice (e) and AID+YFP+ mice (f) were stained with specific fluorochrome-tagged antibodies for iNOS, TNFα and IgA (or visualized for YFP) as indicated. Stained sections were then analyzed by fluorescence microscopy at 200x. Representative pictures are shown from at least 3 separate experiments. Arrows denote areas of co-localization and the rectangle indicates a villus that was enlarged to visualize simultaneous expression of each iNOS, TNFα and YFP.

