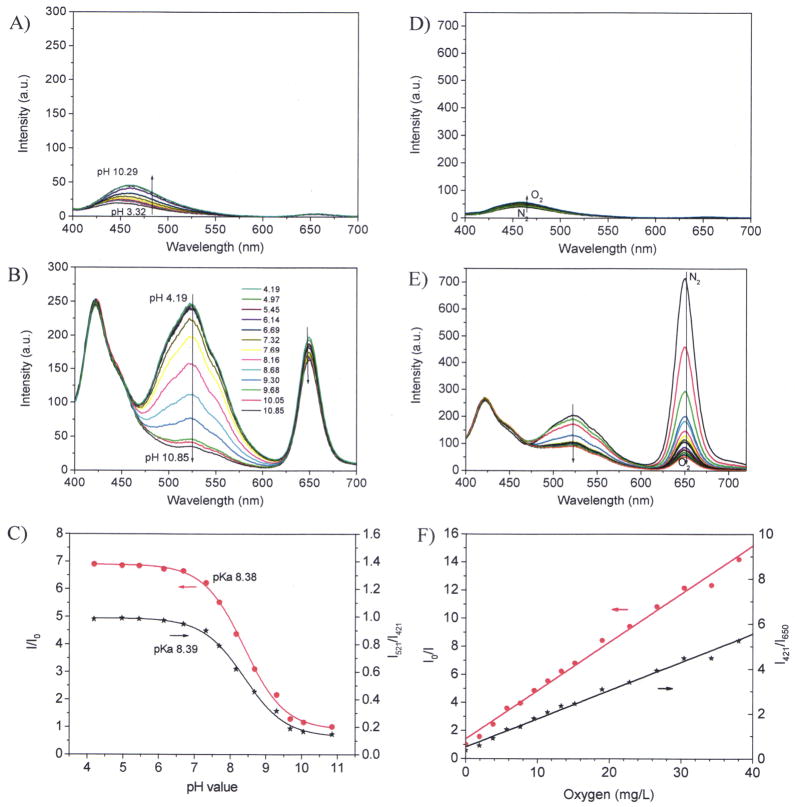
Figure 3.
Sensor responses with cyanobacteria (OD730 of 0.5). A) autofluorescence of cells at different pH values; B) pH responses of the sensor film with cells at different pH values; C) Sigmoidal plots of the pH responses with cells using the single pH sensor emission intensities at 521 nm and the ratiometric ratios at 521 nm and 421 nm; D) autofluorescence of cells via oxygen concentrations; E) emission spectral changes at different oxygen concentrations; F) Stern-Volmer plots of oxygen responses using the single oxygen sensor emission intensities at 650 nm and the ratiometric ratios at 650 nm and 421 nm.

