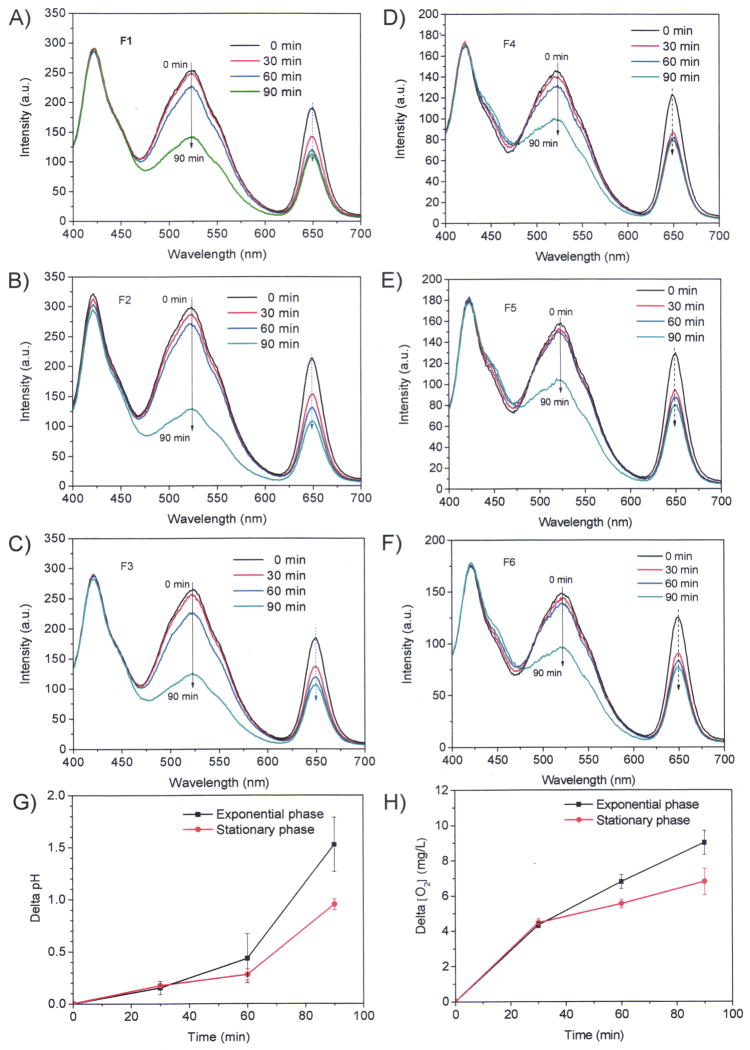
Figure 4.
Monitoring pH and oxygen changes using the optical sensors. A, B, and C are for the measurements at exponential phases at room temperature using three different films; D, E, and F are for the measurements at stationary phases at room temperature using three different films. G gives the time-dependent differences of pH values of the stationary phase and exponential phases. H gives the time-dependent differences of dissolved oxygen concentrations of the stationary phase and exponential phases. OD730 of the cell densities for these studies are 0.5.

