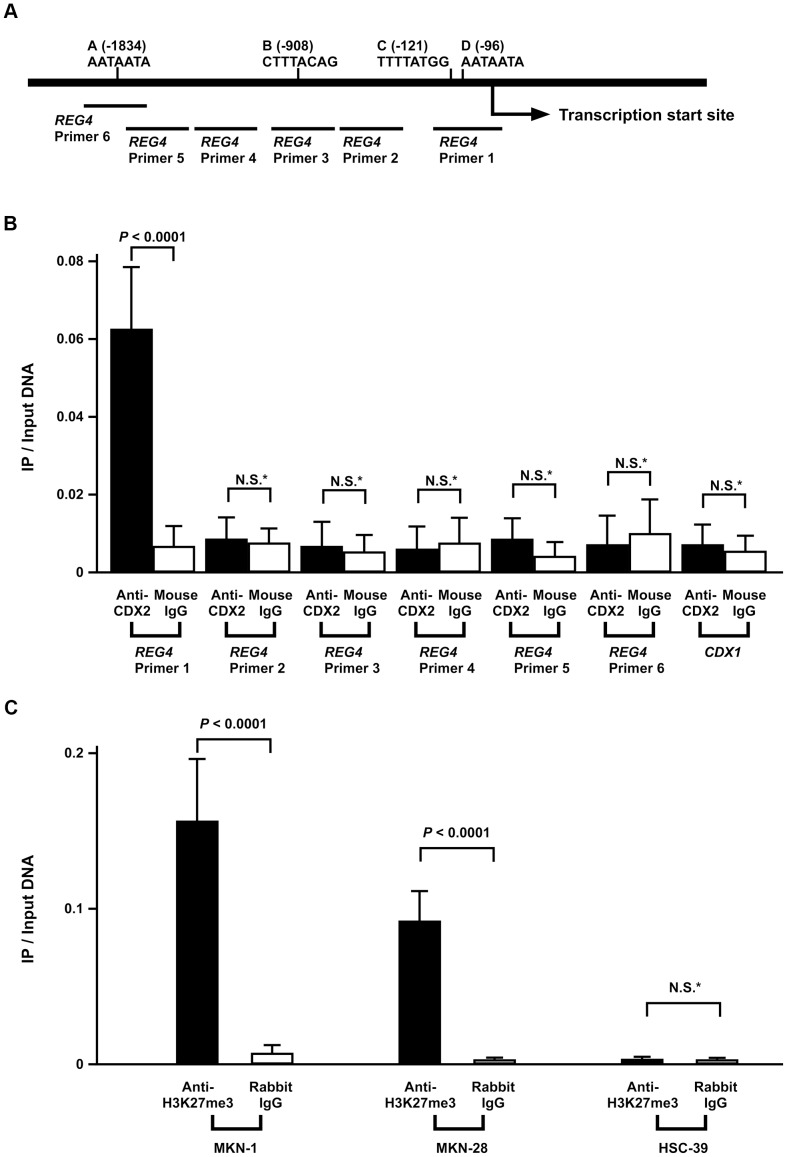
Figure 3. ChIP analysis of the 5′-flanking region of the REG4 gene.
A: Schematic representation of the 5′-flanking region of the REG4 gene. The location of 4 consensus CDX2-binding sites in the 5′-flanking region of REG4 (sites A, B, C, and D) and PCR primers (REG4 Primer 1, 2, 3, 4, 5, and 6) are indicated. B: CDX2 binding to REG4 promoter region shown by ChIP. Bulk (input) DNA was prepared as well as DNA isolated from ChIP with anti-CDX2 monoclonal antibody or mouse IgG. qPCRs were performed in triplicate for each sample primer set, and the mean and SD of the three experiments was calculated. C: ChIP analysis of H3K27me3 enrichment in the REG4 gene promoter. ChIP enrichment was measured using qPCR. qPCRs were performed in triplicate for each sample primer set, and the mean and SD of the three experiments was calculated. P values were calculated using Student′s t-test. * N.S. = not significant.

