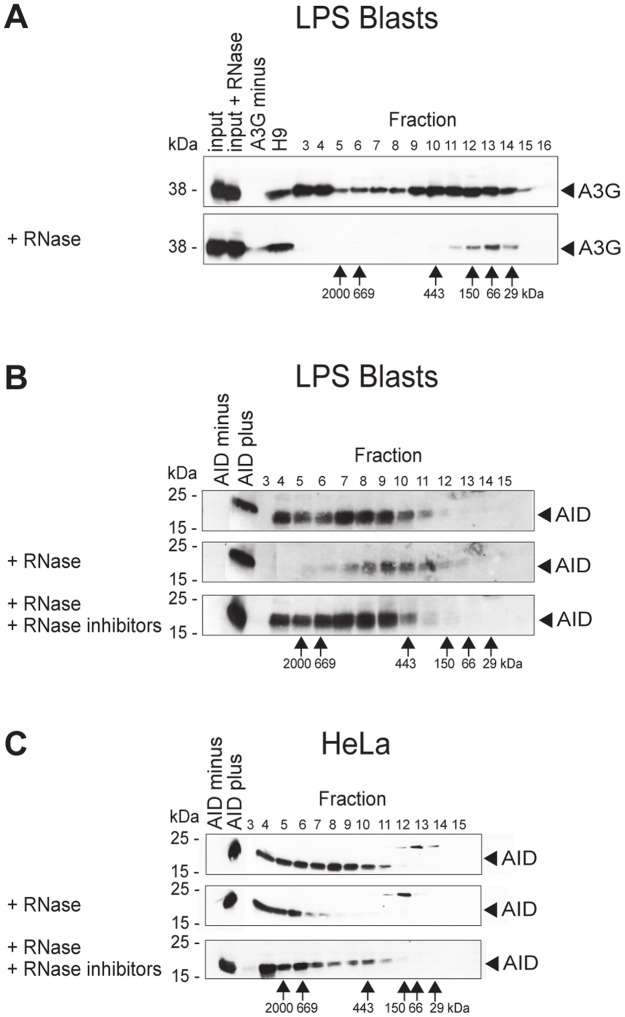
Figure 4. AID forms high-molecular-mass complexes in the cytoplasm.
Fractionation according to size by gel filtration of A3G (A) and AID (B and C), followed by Western blot analysis. Numbers above panels, fractions of separation by FPLC; numbers to the left of panels, molecular mass standards (in kDa) of the SDS gel run; numbers below panels, molecular mass standards (in kDa) of the fractions of the FPLC run. (A) Western blots of fractions of FPLC eluates were developed with polyclonal antibody to A3G. Input, untreated lysate of A3G-positive cells; input + RNase, RNase A-treated lysate of A3G-positive cells; A3G minus, lysate of A3G-negative cells; H9, A3G-positive cell line; fractions 3–16, fractionated lysates of LPS- plus IL-4-activated B lymphocytes from human A3 transgenic mice. Upper panel, untreated cell lysate (devoid of nuclei); lower panel, treated with RNase A before fractionation on FPLC. (B and C) Western blots of fractions of FPLC eluates developed with monoclonal antibody to AID. AID minus, lysate of AID-negative HeLa cells; AID plus, lysate of AID-positive HeLa cells; fractions 3–15, fractionated lysates of LPS- plus IL-4-activated B lymphocytes from AID-sufficient mice (B) and of AID-positive HeLa cells (C). Top panel, untreated cell lysate (devoid of nuclei); middle panel, treated with RNase A before fractionation on FPLC; bottom panel, treated with RNase A and RNase inhibitors before fractionation. Concomitant with RNase A treatment, proteins were somewhat digested for unknown reasons.

