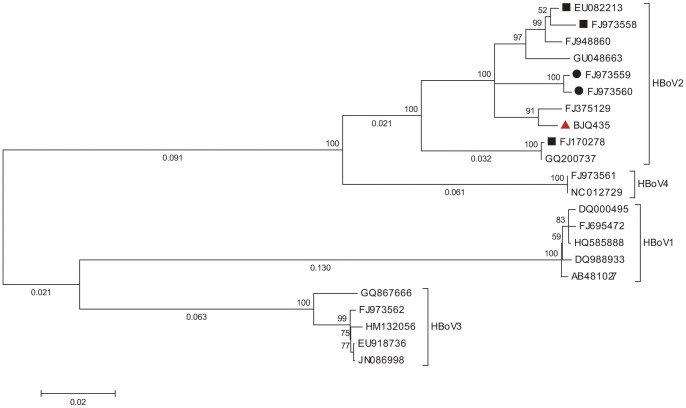
Figure 2. Phylogenetic analysis of HBoV2-C1 (BJQ435, red triangle) and other nearly complete genomes of HBoV1-4.
Nucleotide alignments were performed using the genomic sequences, except for the terminal non-coding region between the VP1/VP2 and NS1 genes. A phylogenetic tree was constructed using the maximum likelihood method with the GTR + G model and 1,000 bootstrap replicates in MEGA 5. The percent bootstrap higher than 50 is shown at nodes, and branch lengths more than 0.02 are shown below the branches. Reference strains of HBoV2A and HBoV2B were labeled with black rectangles and black circles, respectively.

