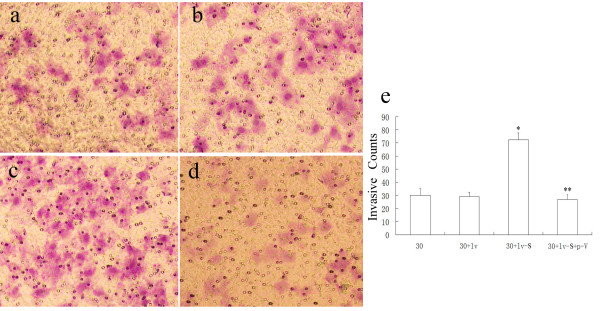
Figure 2.
Matrigel invasion assay from different processed cells.a,b,c and d show the invasive cells of group 30, group 30 + lv, group 30 + lv-S and group 30 + lv-S + p-V under a microscope(200×). e shows the mean number counted from above visual field. * means statistically significant different between 30 + lv-S and ZR-75-30 cells. ** means significant different between 30 + lv-S and 30 + lv-S + p-V(both p<0.05).

