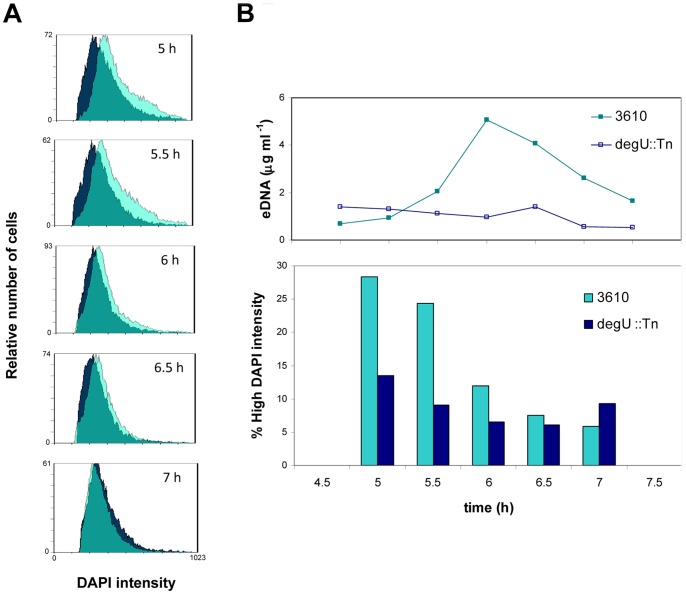
Figure 6. Flow cytometry analysis.
A. Graphs show the overlapping of the DAPI intensity profiles of the wild type 3610 (light green) and the degU::mini-Tn10 mutant (GP229) (dark blue), at several time points during growth. B. Upper side graph represents eDNA levels of 3610 and degU::mini-Tn10 mutant. In the lower graph, bars represent percentage of cells with DAPI intensity higher than the mean in B. subtilis 3610 and degU::mini-Tn10 mutant (GP229). Only one representative experiment is shown of two independent experiments. Growth was similar in both cases.

