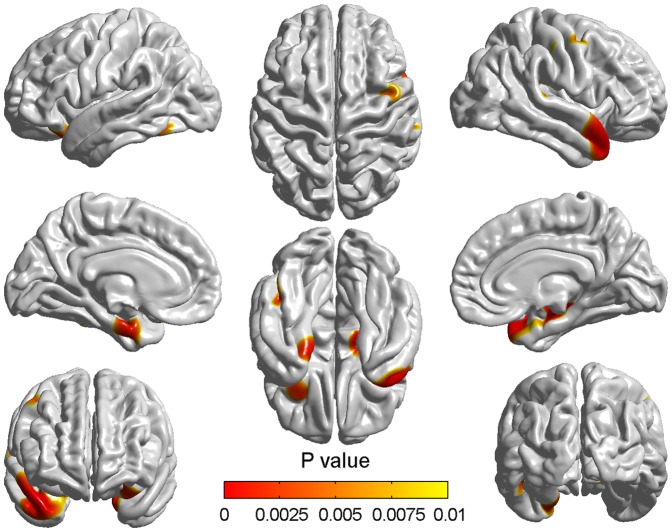
Figure 2. Differences of cortical thickness between the baseline and two years later in NC.
The colorized areas indicated the different cortical thickness between the NC_M1 and NC_M2 groups. The range and degree of atrophy in NC_M2 were sight. The p values of the vertices indicated by the color bar were corrected using the FDR correction.

