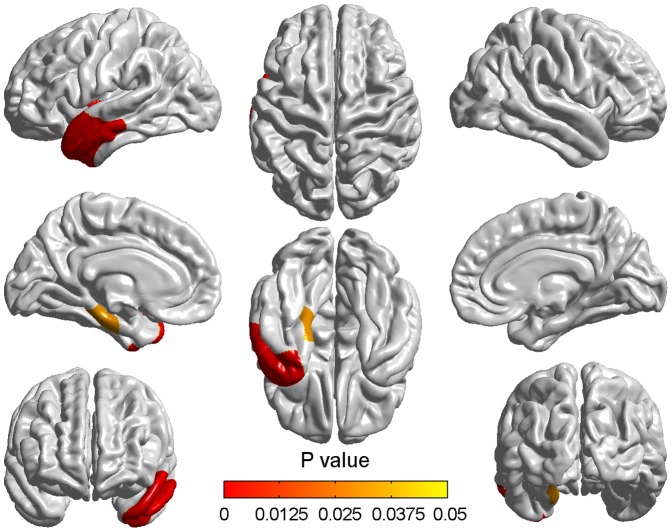
Figure 5. Differences of atrophy rate between aMCI and normal aging over two years.
Differences of atrophy rate between aMCI subjects and normal controls were obtained using the random field theory (RFT)-based cluster analysis. The colorized areas represented the between-group differences of atrophy rate, which showed the more serious atrophy in aMCI over two years. The color bar indicated the cluster-wise p-value with the correction for multiple comparisons.

