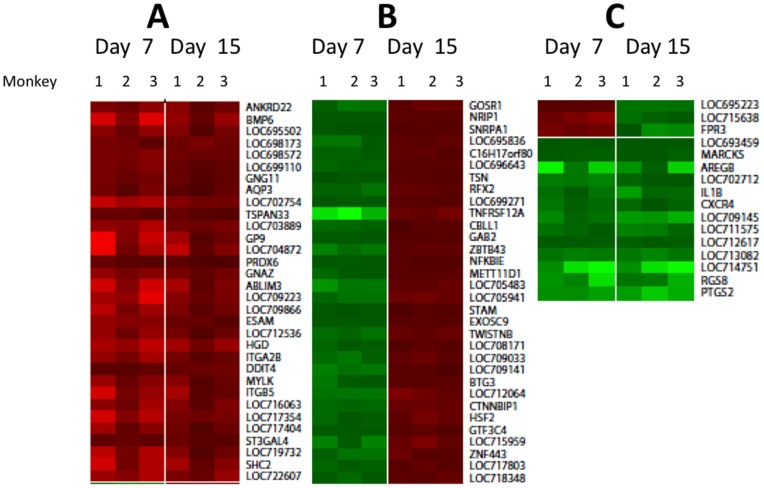
Figure 6. Changes in gene expression in PBMC induced by hep-ATIII treatment of chronically SIV-infected rhesus macaques.
The GeneChip® Rhesus Macaque Genome Array was used to assay genome-wide RNA expression (47,000 transcripts) in rhesus macaque PBMC before and after hep-ATIII treatment (n = 3). Differential gene expression comparison of time points when lentiviral replication was observed (day 7) and after viral replication returned to baseline (day 15) for the three monkeys are shown. Only loci or genes that were significantly (P<0.01, ΔΔCt method) up-regulated (red) and down-regulated (green) in comparison to pre-treatment controls are shown. A 3-step color contrast for low, medium and high gene expression change was used. (A) Group of genes significantly up-regulated at the day 7 and 15 day time points compared to pre-treatment controls. (B) Genes significantly down-regulated at day 7 time point but significantly up-regulated at the day 15 time point compared to pre-treatment controls. (C) Genes either significantly up-regulated at the 7 day time point and down-regulated at the 15 day time point, or else significantly down-regulated at both time points compared to pretreatment controls. Full names of genes are given in Table S1.

