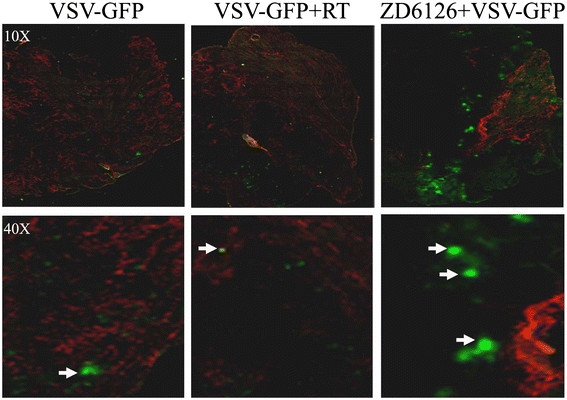
Figure 3.
Representative examples of VSVΔ51 tumour microdistribution in FaDu xenograft tumours. Viral distribution (GFP) was assessed at 24 h post infection in relation to active vasculature (Hoechst, red). The merged field consisted of superimposed VSV, and Hoechst; the close-up images are high-resolution representations of GFP distribution in relation to local blood vessels.

