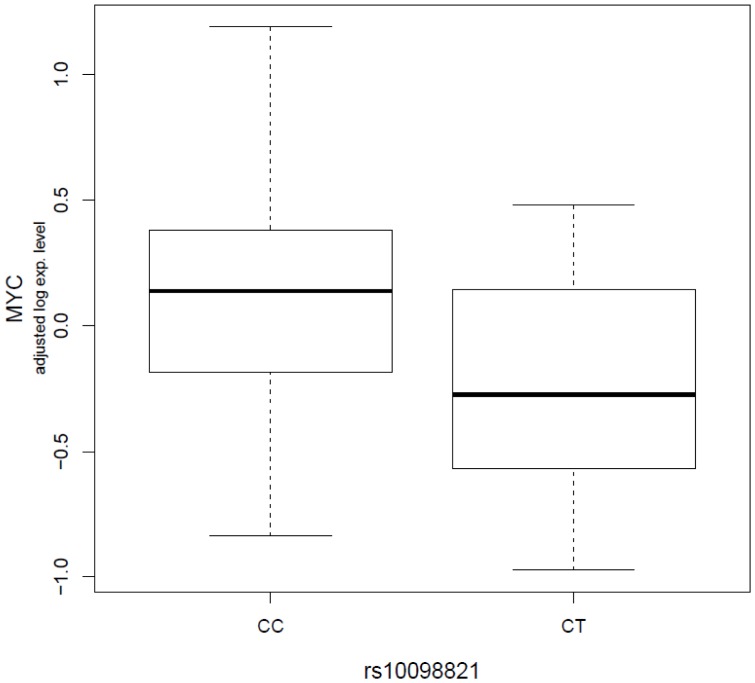
Figure 1. Significant cis-associations between rs10098821 genotype and c-Myc expression phenotypes.
The boxplot shows the relationship between log2 residuals of c-Myc expression levels (adjusted for age and case-control status) and genotype of the rs10098821. rs10098821 explained approximately 4.0% of the variation in c-Myc expression as measured by adjusted r2.

