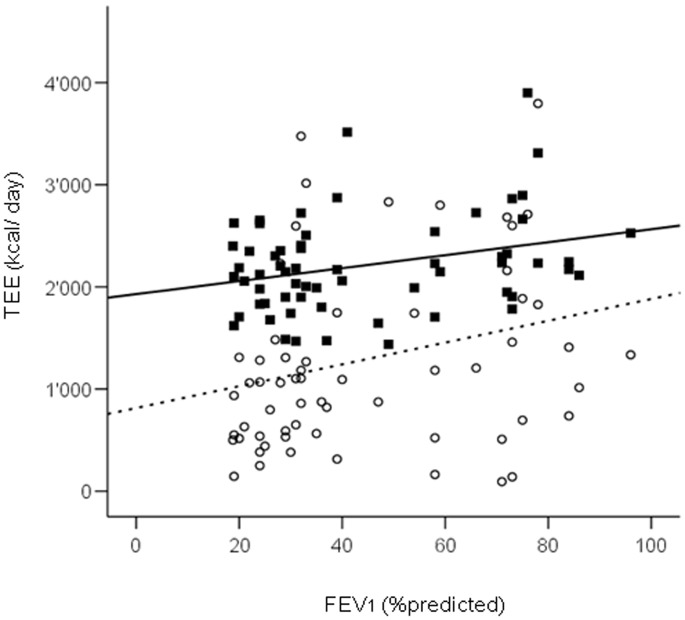
Figure 3. Scatterplots showing the relationship between FEV1 (%predicted) and the total energy expenditure as assessed by accelerometry, TEEACC (black squares) (r = 0.32, 95% 0.09 to 0.52, p = 0.011) and by the Zutphen Physical Activity Questionnaire, TEEZPAQ (white dots) (r = 0.31, 95% CI 0.81 to 0.51, p = 0.012), respectively.
Patients with COPD seem to underestimate their daily PA level.

