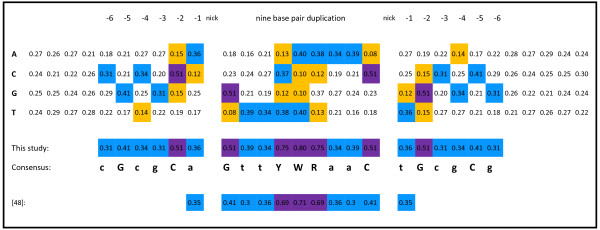
Figure 2.
An extended motif for transposon integration hot spots. Integration sites that occurred in the same location and were overrepresented in more than one transposon library were aligned and a consensus was obtained. Base frequencies over 50% are purple, between 30 and 50% light blue, and below 16%, orange.

