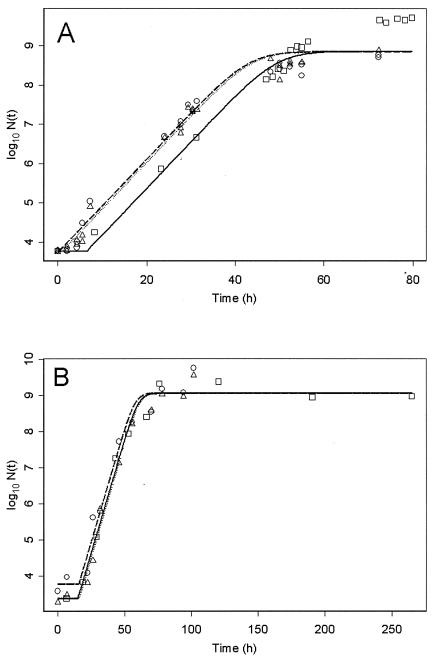
FIG. 1.
Growth of an E. coli O26 strain in cooked poultry meat (A) and of a B. cereus strain in crab sticks (B) at 15°C. The points represent observed data (squares, first trial; circles, second trial; triangles, third trial), and the lines represent adjusted primary model (continuous line, first trial; dashed line, second trial; dotted line, third trial). The models are adjusted with common μmax and Nmax for all trials, but with one λ and one N0 for each separate experiment.

