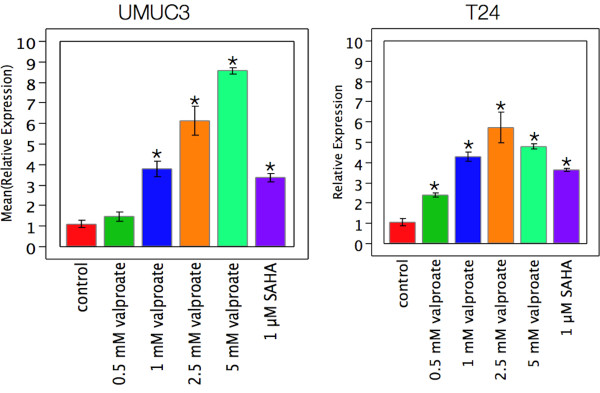
Figure 3.
Induction of TSP1 mRNA expression by HDAC inhibitors in bladder cancer cell lines. Statistically significant differences (t-test, p < 0.05) relative to control are indicated by *. Cells were treated for three days with indicated drugs and concentrations. TSP1 expression increased with dose in both cell lines. The increase was statistically significant at and above 1 mM valproate for UMUC3 and at and above 0.5 mM valproate for T24 cells. SAHA treatment at 1 μM induced TSP1 in both cell lines but decreased cell viability at 5 μM to the point that RNA yields were insufficient for qPCR analysis.

