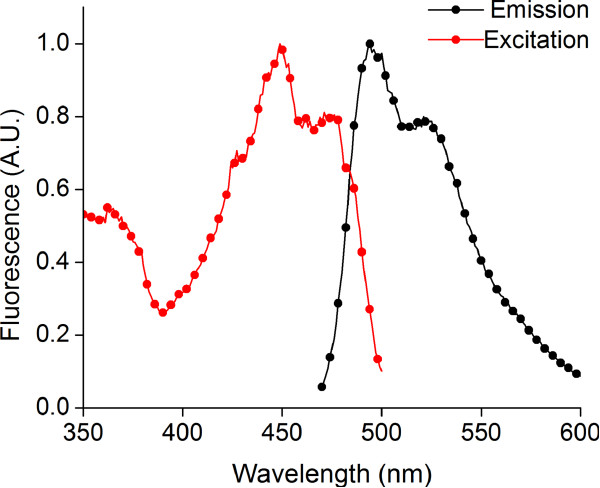
Figure 1.
Fluorescence excitation and emission spectra for purified wild type FbFP protein. (a) Excitation spectrum of purified FbFP in Buffer E (25 mM sodium phosphate, 1 M sodium chloride, pH 7.4). Excitation spectrum was determined by monitoring fluorescence emission at 500 nm while scanning the excitation light between 350 to 480 nm. (b) Emission spectrum of purified FbFP in Buffer E. Emission spectrum was determined by monitoring fluorescence emission between 470 and 600 nm while exciting the sample at 450 nm.

