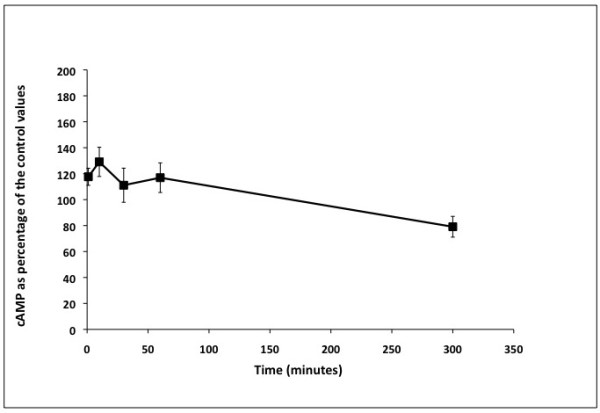
Figure 5.

Effects of progesterone on intracellular cAMP inS. schenckii. This figure shows the cAMP response curve after the exposure of S. schenckii yeast cells to progesterone for different time intervals. The cells were grown in a variation of medium M for 4 days and aliquots were removed and exposed to progesterone as described in Methods. The intracellular levels of cAMP were measured as described in Methods using the cAMP Direct Immunoassay kit (Calbiochem, La Jolla, CA, USA). The cAMP concentration was determined for at least 7 independent experiments and the values expressed as percentage of the untreated controls (ethanol only) ± the standard error of the mean. Significance of the data was determined using the Student’s T test and at a p<0.05. Analysis of Variance between groups was done using Bonferroni Test for differences between means.
