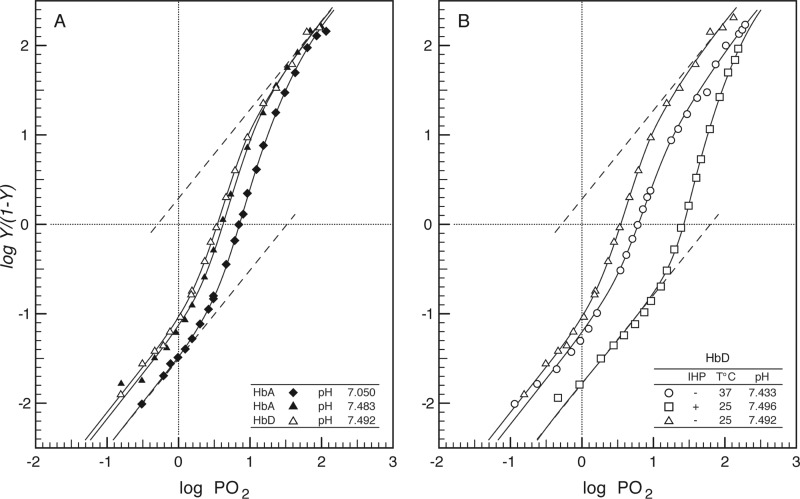
FIGURE 3.
Extended Hill plots of O2 equilibria (where Y = fractional O2 saturation) for pheasant HbA and HbD. A, HbA and HbD at 25 °C; B, HbD at 25 and 37 °C and in the absence and presence of saturating IHP concentration (IHP/Hb ratio = 23.5). In each plot, the intercept of the lower asymptote with the horizontal line at logY/(Y − 1) = 0 provides an estimate of KT, the O2 association constant of T-state deoxy-Hb, and the intercept of the upper asymptote with the same line provides an estimate of KR, the O2 association constant of R-state oxyHb. Heme concentration 0.60 (HbA and HbD); other conditions are as described in the legend for Fig. 2.

