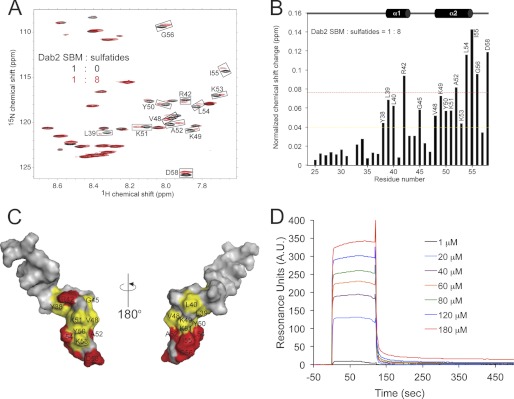
FIGURE 3.
Dab2 SBM binds sulfatides. A, overlay of 1H, 15N HSQC of DPC-bound Dab2 SBM in the absence (black) and presence (red) of DPC-bound sulfatides. Perturbed chemical shifts are boxed and labeled with the corresponding residue. B, histogram representing the normalized chemical shift changes of Dab2 SBM induced by sulfatides. The colored bars represent significant perturbations: red (Δδaverage + 1 × S.D.) > yellow (Δδaverage). C, Dab2 SBM amino acids that display significant chemical shift changes are labeled and color-coded according to the scale defined in B. D, binding plot of the Dab2 SBM to sulfatide liposomes using SPR analysis. A. U., arbitrary units.

