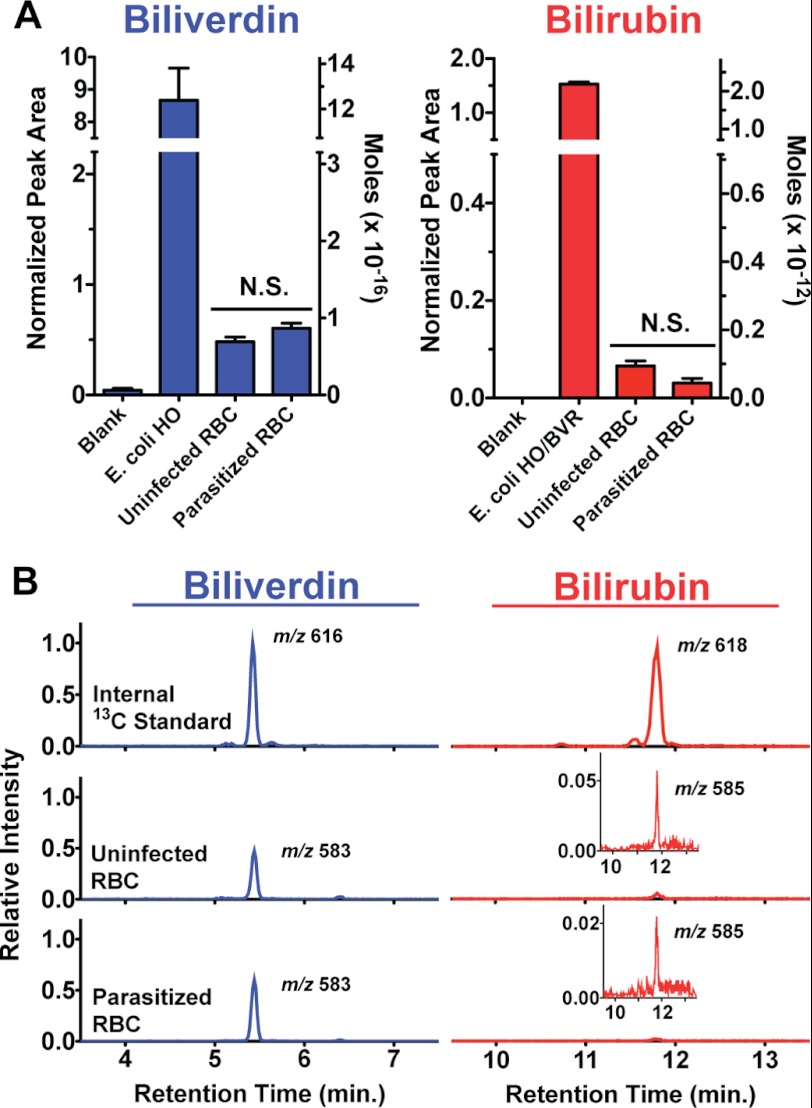
FIGURE 3.
LC-MS/MS measurement of biliverdin and bilirubin in parasite-infected versus uninfected red blood cells. Cells were extracted in DMSO, known amounts of 13C-labeled BV and BR internal standards were added, and samples were analyzed by LC-MS/MS. The integrated area of the BV and BR peak detected for each sample was normalized against the respective peak area for each internal standard. The average normalized peak area and standard error from four independently prepared and processed replicates are shown in A, and representative mass spectra with indicated [M + H]+ masses are shown in B. N.S. = not significantly different by unpaired t test (p = 0.11 [BV], 0.05 [BR]). The insets in B are expanded y axis views of the detected peaks. Estimated molar amounts of each analyte detected in injected samples have been included on the right y axis in A to facilitate comparison between BV and BR levels, as the normalized peak areas for the two analytes cannot be directly compared due to differing amounts of BV and BR internal standards added to samples (see “Experimental Procedures”).

