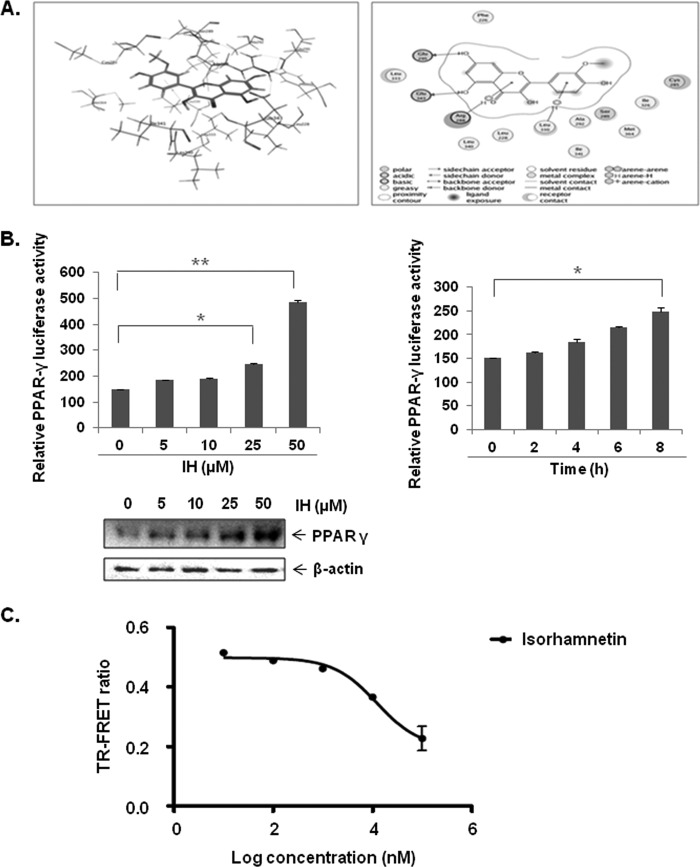
FIGURE 5.
A, the ligand interaction map of IH inside PPAR-γ (left panel) and three-dimensional conformational structure of IH inside PPAR-γ (right panel). B, IH increases PPAR-γ activity in a dose dependent manner, also shown by Western blot (left panel). IH also increases PPAR-γ activity in a time-dependent manner (right panel). The cells were transfected with pPPRE-tk-Luc and β-gal plasmid for 4 h before treatment with the indicated concentrations of IH. The data are expressed as percentages of the PPAR-γ activity relative to the control. The values are the means ± S.E. of two or three independent experiments. *, p < 0.05; **, p < 0.01. C, in vitro competitive binding assay showed that IH could bind competitively to PPAR-γ. Serial dilutions of IH (1% final Me2SO concentration, serial dilutions performed in 100% Me2SO) were prepared in a 384-well polypropylene assay plate. FluormoneTM Pan-PPAR Green, PPAR-γ-LBD, and Tb-anti-GST Ab were then added to each sample well as described in the protocol. The assay mixture was incubated for 1 h at room temperature prior to measuring the 520-nm/490-nm emission ratio of each well. The error bars represent the S.E. of duplicate wells (n = 2).

