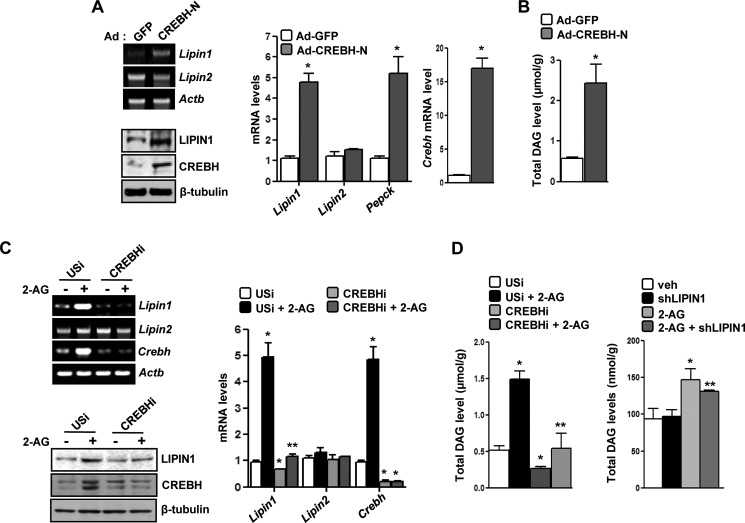
FIGURE 3.
Crebh-mediated induction of Lipin1 gene expression and increase in hepatic DAG level in vivo. A and B, mice (n = 5) were infected with the indicated adenoviruses for 72 h. Following completion of the experiments, mice were sacrificed, and liver tissues were obtained for semiquantitative PCR (top left) or qPCR (right) analyses and for measuring protein levels (bottom left). The DAG level was measured in Ad-GFP- and Ad-CREBH-N-infected mouse liver samples (B). *, p < 0.05 versus Ad-GFP. C, mice (n = 5) were infected with the indicated adenoviruses, and 96 h postinfection, mice were treated with 2-AG for a further 12 h. Liver tissues were obtained for semiquantitative PCR (top left) or qPCR (right) analyses and for measuring protein (bottom left). *, p < 0.05 versus USi; **, p < 0.05 versus USi + 2-AG. Data represent mean ± S.E. D, mice (n = 5; left) or AML12 cells (right) were infected with the indicated adenoviruses, and 96 h postinfection, mice were treated with 2-AG for a further 12 h. The DAG level was measured in adenovirus-infected mouse liver samples (left) and in AML12 cells (right). *, p < 0.05 versus USi/vehicle (veh); **, p < 0.05 versus USi/vehicle + 2-AG. All data represent mean ± S.E. (error bars).

