FIGURE 8.
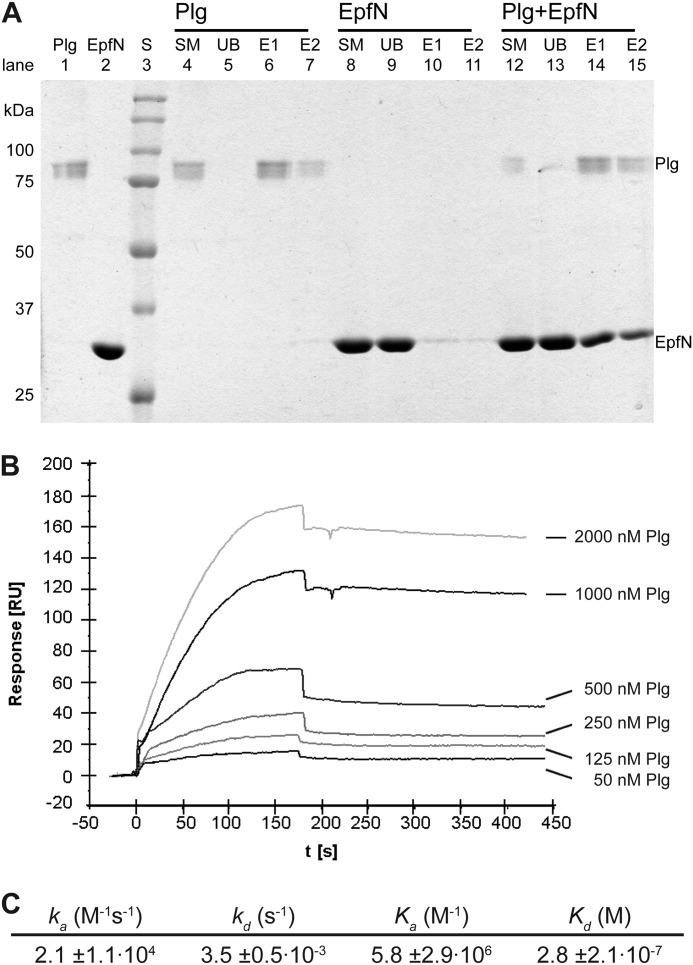
Interaction between EpfN and human plasminogen. A, binding of EpfN to immobilized plasminogen in a pulldown assay. Plg was immobilized on lysine-Sepharose and could be eluted with ϵ-amino caproic acid (lanes 4–7). EpfN alone did not bind to lysine-Sepharose (lanes 8–11) but co-eluted with plasminogen (lanes 12–15). Lanes 1 and 2 show pure plasminogen and EpfN samples. S, protein standards; SM, starting material; UB, unbound material after incubation with lysine-Sepharose; E1 and E2, fractions eluted with ϵ-amino caproic acid. B and C, quantification of the interaction of Plg (analyte) with immobilized EpfN (ligand) using surface plasmon resonance measurements. B, representative profile of the relative surface plasmon resonance responses for the association and dissociation of different analyte concentrations (50–2000 nm). Injection of the analyte started at time 0 and ended after 180 s, whereupon the dissociation phase was documented for at least 270 s. Shown is one representative concentration series out of three independent experiments. C, the association and dissociation data of the interaction were fitted globally using the one step biomolecular reaction model (1:1 Langmuir binding with drifting base-line model: A+B ⇄ AB), which resulted in optimum mathematical fits reflected by the lowest χ2 values (0.3–5). The values for association rate (ka), dissociation rate (kd), association constant (Ka), and dissociation constant (Kd) were calculated from the binding data with the BIAevaluation software. The mean values from three independent experiments are presented in the table ± standard deviation.

