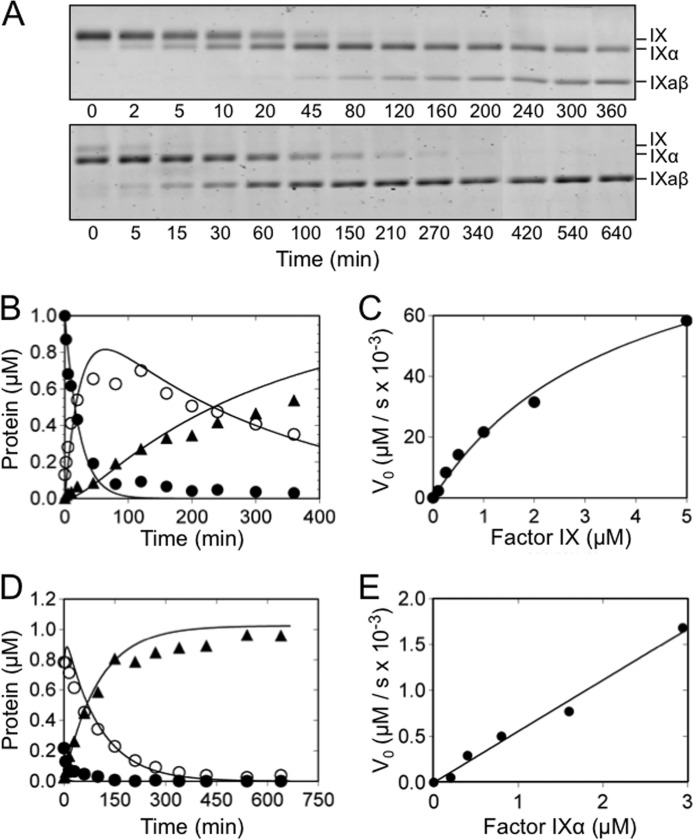
FIGURE 3.
FIX and fIXα cleavage by fXIa/PKA3. A, nonreducing 17% polyacrylamide-SDS gels of 1000 nm fIX (top) or fIXα (bottom) in assay buffer with Ca2+ incubated at room temperature with fXIaPKA3 (60 nm and 240 nm active sites for fIX and fIXα, respectively). Positions of standards for fIX, fIXα, and fIXaβ are indicated at the right of each panel. B, progress curves of fIX disappearance (●), and fIXα (○), and fIXaβ (▴) generation from panel A (top). Lines represent least-squares fits to the data. C, initial velocities of cleavage after Arg145 (conversion of fIX to fIXα) by 1 μm fXIa/PKA3 active sites as a function of fIX concentration. The initial rates were obtained from the slopes of the linear portions of progress curves documenting disappearance of fIX with time. D, progress curves of fIXα cleavage by fXIa/PKA3 determined from panel A (bottom). E, initial velocities of cleavage after Arg180 (conversion of fIXα to fIXaβ) by 1 μm fXIa/PKA3 active sites as a function of fIXα concentration.

