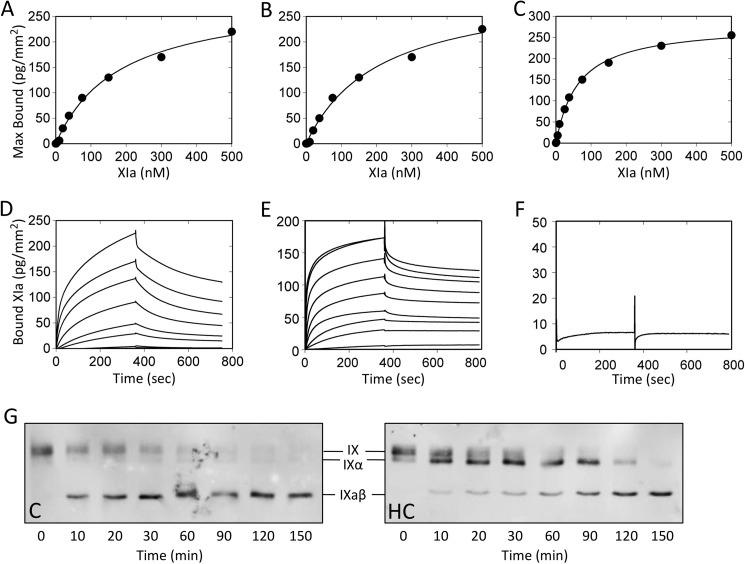
FIGURE 5.
FXIa binding to fIX, fIXα, and fIXaβ. Surface plasmon resonance was used to assess binding of fXIa perfused over immobilized fIX, fIXα, or fIXaβ in the presence of Ca2+ ions at 10 μl/min for 6 min. Dissociation was monitored for 10 min. Panels A–C, fXIa-WT binding. FXIa-WT concentrations tested were: 1, 5, 10, 25, 37.5, 75, 150, 300, and 500 nm. Affinity and kinetic parameters were determined after subtraction of nonspecific binding from the control surface. Nonlinear regression fitting of the steady state equilibrium binding of fXIa-WT to (A) fIX, (B) fIXα, and (C) fIXaβ was performed using a bivalent model. Panels D–F, surface plasmon resonance data for Ca2+-dependent binding of fXIa-WT, fXIa-HC, and fXIa-CD binding to fIX. D, shown are curves for fXIa-WT binding to immobilized fIX at analyte concentrations listed above. E, binding curves for fXIa-HC at the same concentrations used for fXIa-WT. F, binding curve for fXIa-CD at a single analyte concentration (5000 nm). Panel G, effect of fXIa-HC on fIX activation by fXIa-WT. Shown are Western blots of time courses of fIX (100 nm) activated by fXIa-WT (2 nm active sites) in the presence of vehicle control (C) or 1 μm fXIa-HC (HC). Samples collected at various times (shown at bottom) into nonreducing SDS sample buffer were size fractionated by SDS-PAGE. Detection was with a polyclonal anti-human fIX antibody and chemiluminescence. Positions of standards for fIX, fIXα, and fIXaβ are shown between the images.

