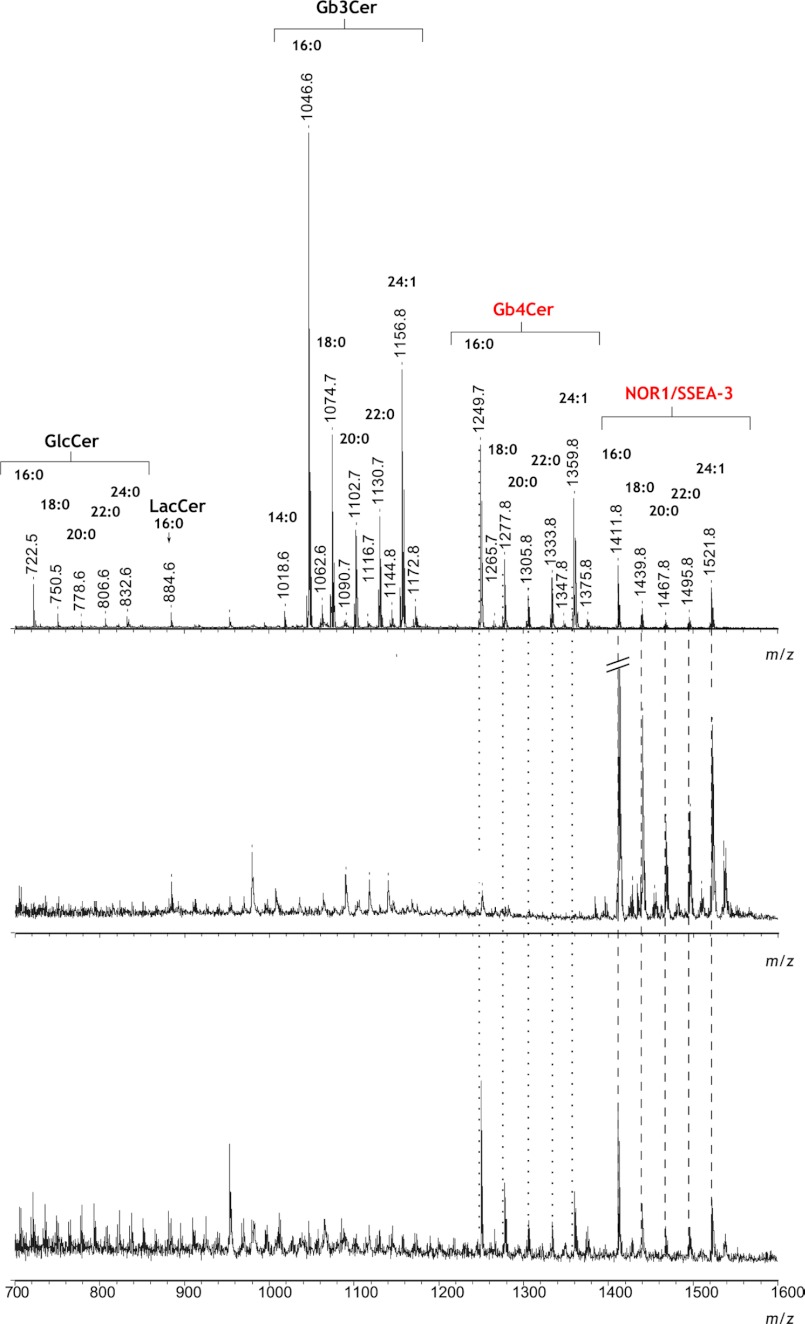
FIGURE 5.
Reflectron-positive mode MALDI-TOF mass spectra of glycolipids isolated from 2102Ep cells transfected with vectors encoding the Gb3/CD77 Q211E synthase. Shown are spectra from the total neutral glycolipid fraction (upper panel) and the NOR1 glycolipid isolated from the HPTLC plate, first as the native sample (center panel) and then following treatment with coffee bean α-galactosidase (bottom panel). All experiments were carried out as described under “Experimental Procedures.” The dotted lines indicate ions diagnostic for NOR1/SSEA-3 and Gb4Cer. Acyl group symbols (e.g. 16:0) indicate the glycolipid isoforms.

