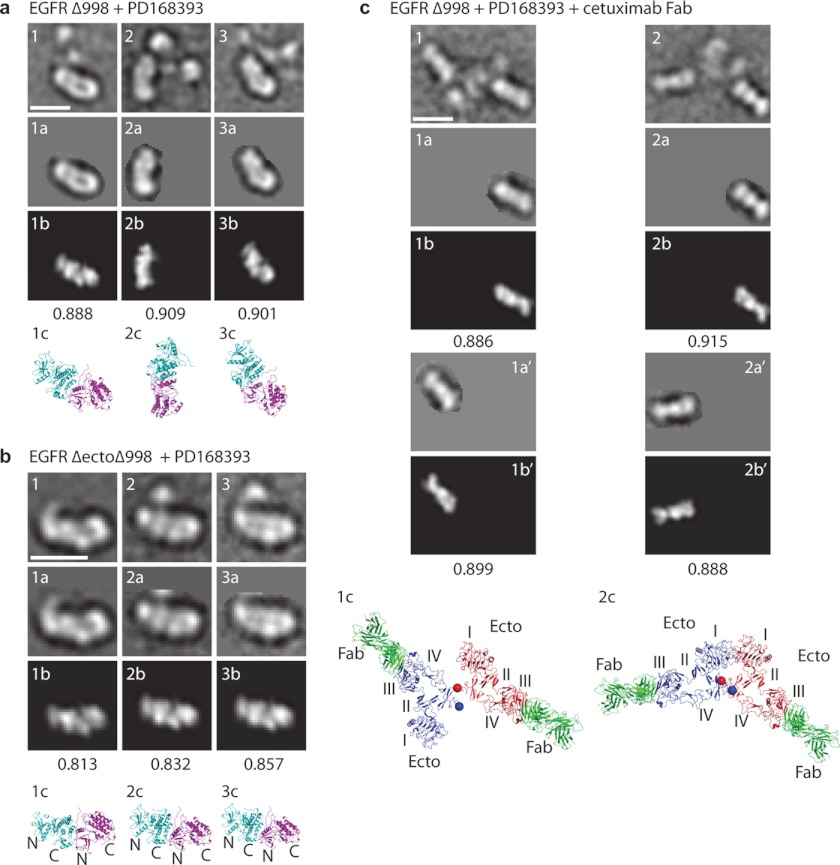
FIGURE 6.
Correlation of EM densities with crystal structures. Representative class averages are shown in the first row of each panel, with masked areas in the second row (labeled a), best correlating projections with crystal structures and cross-correlation scores in the third row (labeled b), and ribbon diagrams in the same orientation but at larger scale in the bottom row (labeled c). The cross-correlations in a and b are with the asymmetric kinase dimer from (10) (Protein Data Bank code 2GS6). Cross-correlations in c are with the Fab and EGFR domain III moieties (residues 311–503) from the crystal structure of cetuximab Fab bound to EGFR (25). In c, each monomeric unit was separately masked and cross-correlated. Using the orientation established for the Fab and domain III, the entire EGFR ectodomain Fab complex for each monomer is shown, preserving their relative spatial orientations, in the bottom panel of c. Scale bars, 10 nm.

