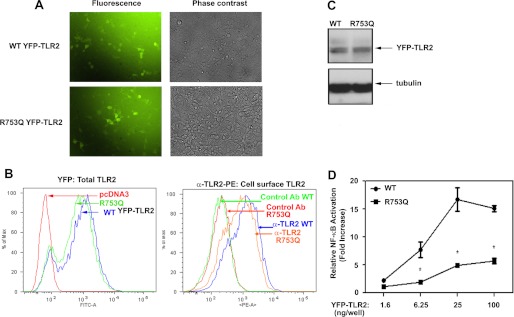
FIGURE 1.
Expression levels and signaling capacities of WT and R753Q YFP-TLR2 species. A–D, HEK293 cells were transiently (A, C, and D) or stably (B) transfected with expression vectors encoding WT or R753Q YFP-TLR2 variants. A, after recovery for 48 h, cells were analyzed by fluorescent and phase contrast microscopy to determine expression levels of the TLR2 variants. B, total expression of transfected YFP-TLR2 variants was determined by FACS analysis, using the YFP fluorescence intensity (FITC channel) (top panel). TLR2 cell surface expression was determined by staining of cells with TL2.1-PE (anti-TLR2 Ab) or isotype control IgG-PE followed by FACS analyses of PE fluorescence (bottom panel). % of Max, percentage of maximum. C, whole cell lysates were examined by immunoblotting using anti-GFP and anti-tubulin Abs. D, HEK293 cells were co-transfected with the indicated amount of plasmids expressing WT or R753Q YFP-TLR2, along with pELAM-Luc (0.2 μg/well). After recovery for 20 h, cells were treated for 5 h with medium or Pam3Cys (100 ng/ml), and firefly Luc activity was determined in cell lysates and normalized for protein levels. The data of a representative experiment (n = 12 (A); n = 5 (B); n = 3 (C and D)) are shown. *, p < 0.05.

