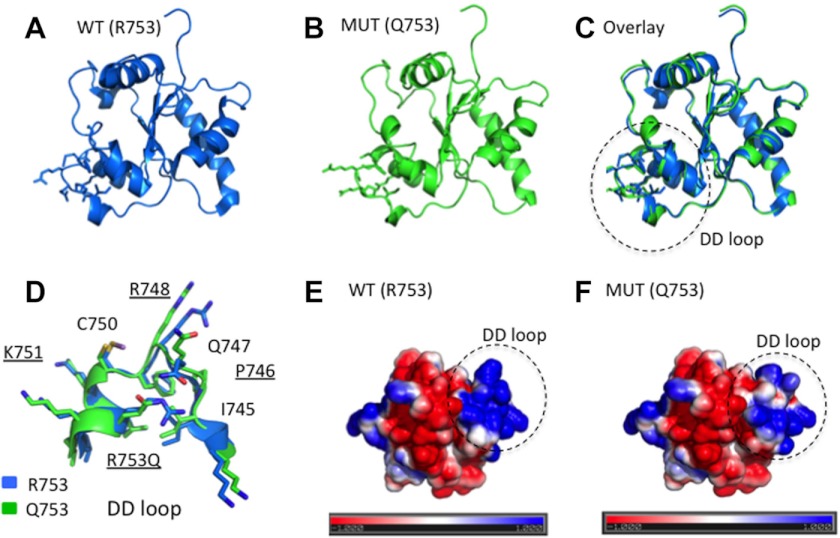
FIGURE 5.
Molecular modeling of the structures of the TIR domains of WT and R753Q TIR2 species. A–C, ribbon models of WT Arg-753 (A) and mutant Gln-753 (MUT Q753) (B) TIR domains of TLR2 and their overlay (C) are shown. D, a close-up of the DD-loop-αD region encircled in C. E and F, the electrostatic surfaces of the WT (Arg-753) (E) versus mutant Gln-753 (F). The electrostatic potential was calculated by solving the Poisson-Boltzmann equation using the APBS PyMOL plug-in and depict a range from − (red)/+ (blue) 1kbT/ec, where kb is the Boltzmann constant, T is the temperature, and ec is the charge of the electron. Surfaces of the TIR2 domains are depicted.

