FIGURE 1.
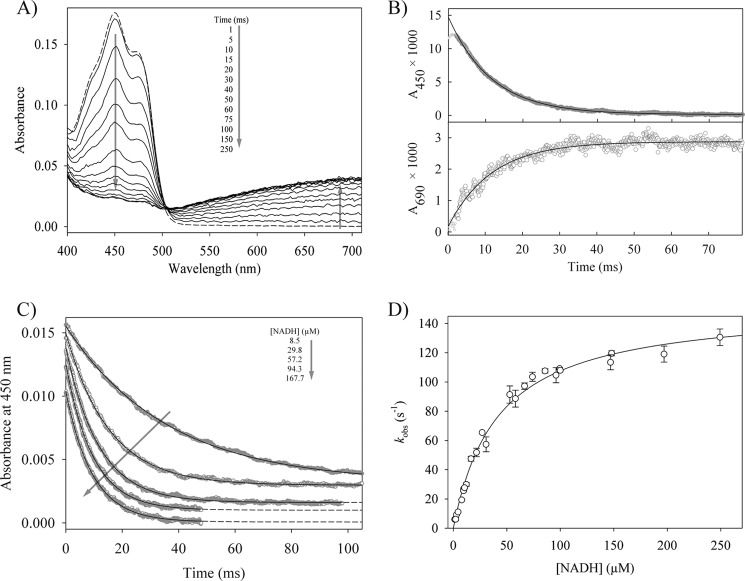
The reductive half-reaction of reductaseTOL. A, time-dependent spectral changes of 15.3 μm oxidized reductaseTOL reacting with 30 μm NADH. The dashed line represents the spectrum of oxidized reductaseTOL, and arrows indicate the direction of absorbance changes. B, time-dependent absorbance change at 450 and 690 nm for the reaction of 1.2 μm reductaseTOL with 57 μm NADH. The solid lines show single exponential fits to the data, yielding observed rate constants of 86.6 ± 0.2 (450 nm) and 85.3 ± 1.6 s−1 (690 nm), respectively. C, stopped-flow traces for the reaction of 1.2 μm reductaseTOL with different NADH concentrations. The traces have been shifted vertically for clarity. The solid lines are single exponential fits of the data. D, dependence of the observed rate constants at 450 nm on the concentration of NADH. The solid line shows the fit to Equation 1, yielding a dissociation constant for the Michaelis complex (reductaseTOL with NADH) of 41 ± 4 μm and a limiting rate constant of 152 ± 4 s−1 for the reduction of reductaseTOL. Error bars denote the S.D. of observed rate constants of at least four measurements per NADH concentration.

