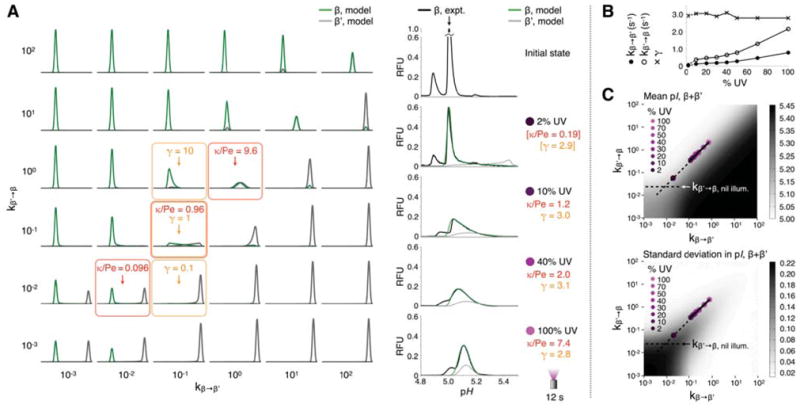
Figure 5.

Two-state convection-diffusion-reaction model predicts focusing dynamics during perturbation of avGFP with UV light. (A) At left, sketch of concentration distributions from 1D model of focusing of bright (β) and dark (β′) states of the major avGFP isoform over a range of interconversion rates; x-axes are pI 4.8–5.5, y-axes are arbitrary fluorescence units.κ/Pe compares reaction to focusing speeds, governing the observed morphology of the β peak during focusing. Concentration distributions of the bright and dark states can be distinct (κ/Pe < 1) or overlapping (κ/Pe > 1) depending on the UV intensity, even for the same equilibrium constant γ. Right hand column, least-squares fits of model distributions of β to experiment data for the indicated UV intensities. Fits from 10%–100% UV were global optima, while that at 2% assumed an average γ value from the other fits (square brackets and dashed lines denote this here and in (B) and (C)). (B) Interconversion rates between β and β′ states and their ratio, γ from fits in (A). (C) Intensity plots of pI mean and standard deviation for the sum of β and β′ distributions. Interconversion rates determined from experimental data in (B) are overlayed. Best-fit slope of 0.94 reflects approximately constant γ and mean pI across the UV range.
